
You are scrolling job postings. Every requirement checks out except the last line, which reads “under 35.” You flick past it and keep scrolling.
Before I read this paper, I was stuck on one thing I could not explain from people around me:who is that line on the job posting actually filtering?My old answer was “older applicants.” After reading the paper, the answer has to change — it does not filter age, it filters whether your age matches the job. People in their thirties who apply for entry-level roles get far fewer replies; people in their early twenties who apply for managerial roles barely get in either. Both ends of the ladder are stuck.
The headline first. Across these 510,000-odd postings,close to 15 percent put an age cap in writing, sitting at 36.3 years on average, and the number written most often is 35; cross the line an employer wrote itself and applications drop 17 percent at the cutoff while firm replies drop by nearly 20 percent. The awkward part: postings that never mention age show reply curves almost identical to the ones that do — I will put a discount on that claim later, because the paper itself calls it descriptive evidence.
Eleven sections, in order: where the data comes from and what it cannot see, what happens across the gate, how plainly the gate is written, the part nobody writes down, what each rung on the ladder pays, the other end where the young get stuck, how much less the people still in the line earned before, the two explanations the paper admits it cannot separate, the doubts I kept after reading, and what this has to do with you. Every number was checked line by line against 原文.
1. My old explanation cannot account for “both ends blocked”
Let me start with why I care.
I have seen two job-seeking situations. One is a colleague in their early thirties, capable, getting a polite “we were hoping for someone younger” after applying for a junior role. The other is someone two or three years into work whose resume goes straight to the bottom when they apply for a managerial role, not even a rejection letter. Normally we tell these two stories separately: the first is age discrimination, the second is not enough experience.
This paper puts both inside one framework. Its central claim istwo-sided: older applicants lose out on entry-level roles, while younger applicants struggle more to be hired into managerial ones (abstract and). In other words, the criterion that hurts you is not your age — it is whether your age and the job you applied to line up.
The paper’s term is a laddered labor market. In plain words:jobs move up one rung at a time — start in a basic role, build proof, then climb. If it is a ladder, every rung has its own ticket. Age is not a scale for ability, but inside this structure it gets used as the checklist at the door.
So the question becomes: does that gate actually do anything? And how plainly is it written? Start with whether it works.
2. What this data is, and what it cannot see
The paper’s data comes froma leading Chinese online recruitment platform. The paper never names it, and I will not name it for them. There are two datasets .
The first is a postings dataset: a nationally representative sample of postings from August and September 2022, restricted to full-time jobs requiring at least a three-year college degree, which leaves 515,434, then a further 5,009 removed for missing key variables, leavinga final analysis sample of 510,425. One figure must be pinned down here: the introduction says the data covers “one million job postings,” but the analysis actually runs on these 510,000-odd — the analysis sample after restrictions applied to the platform’s national postings. The two numbers cannot be swapped. Postings split by experience requirement: 344,907 entry-level (under three years) and 165,518 managerial (three years or more), Table 1.
The second is an applicant dataset: from people who applied to at least one full-time job in August 2022, a random draw of 15,000 job seekers aged 21–45 with bachelor’s degrees; 3,363 excluded (missing key variables or using batch-apply) plus 30 who applied to no identifiable posting,leaving 11,607 people who submitted 333,705 applications over three months. The study setting isGuangdong Province— the paper’s reason is that it has the largest employed population in the country, with 1.32 million new urban jobs in 2022, roughly 110,000 per month . Two national reference figures are also cited from the paper: 12.06 million new urban jobs and 10.76 million college graduates in 2022 (, official figures as cited by the paper).
“Positive response” is the paper’s outcome variable, and the definition is specific:the firm picks “Let’s chat,” “Make a call,” or “Schedule an interview” in the conversation, or expresses equivalent intent in the text. In plain words, the firm comes to you.
The strength of this combination is that who applied to what, and who the firm replied to, sit in one table. The limits are in plain view, and I will book three of them now and settle them in section 10:one province only;applicants stop at age 45, so what happens past 45 is entirely outside the sample;this is a working paper, not peer reviewed.
One more thing worth saying: the data is internal platform records and the paper offers no public replication package, so this article cannot promise the data is reproducible.
The boundaries of the data are settled. So what happens when someone crosses that gate?
3. Across the gate, applications fall by seventeen percent
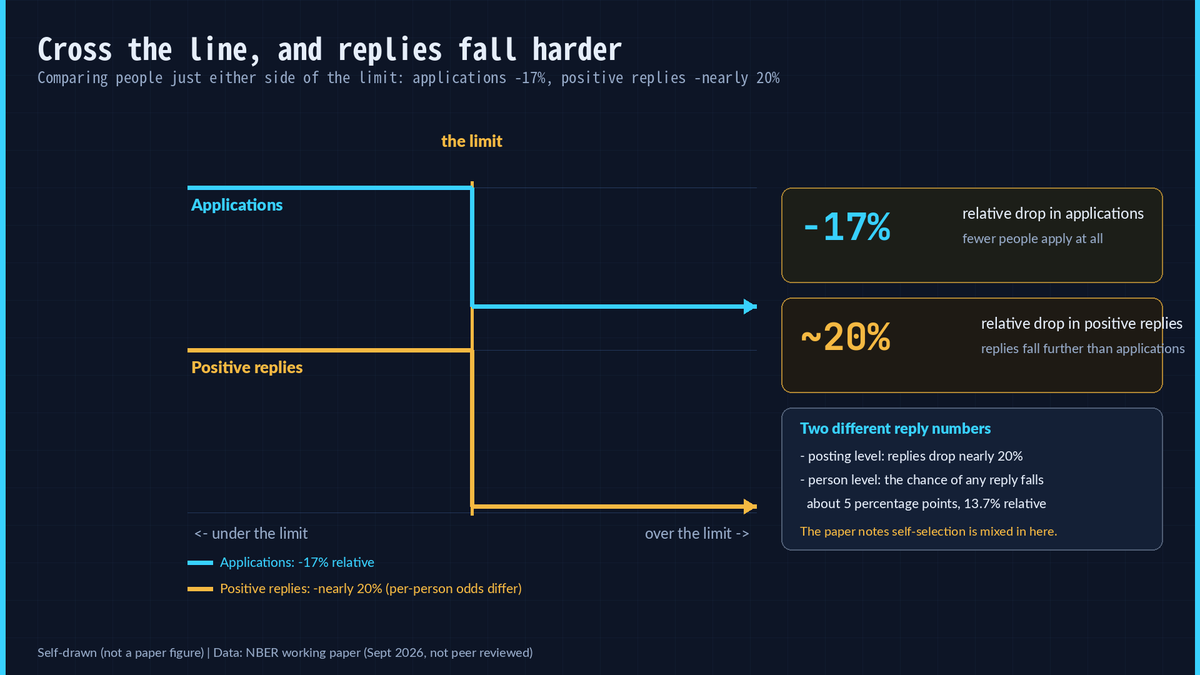
The paper’s method is called regression discontinuity. In plain words:compare people who sit just on either side of the gate, and see whether the treatment suddenly changes a notch. It runs this only on postings that state an age cap (the count comes in section 4), with the running variable measured as the applicant’s age relative to the posted maximum, in months ; the bandwidth follows Calonico et al. (2014) and standard errors are clustered at the firm level . That is all the method I will give — everything below is results.
Three results (; Figures 1a/1b/1c):
- Applications: 0.00161 fewer applications per posting just above the threshold than just below,a 17 percent relative decline;
- Positive firm replies: adiscrete drop of nearly 20 percentat the threshold;
- Individual reply probability: about5 percentage pointslower above the threshold,a 13.7 percent relative decline(drop observations within one year either side of the cutoff and the decline is larger still, 17 percent, footnote 12).
That first block is where I have to nail the measure down:17 percent and nearly 20 percent are relative declines on the two sides of the cutoff. They are not “older people’s job opportunities fell by a fifth,” and not “the reply rate fell to barely a tenth.” The first two are posting-level counts, the third is a person-level probability (5 percentage points, or 13.7 percent in relative terms). Three different rulers.
My reading: fewer people apply and fewer replies come back,which says applicants know the wall is there— applications decline steadily as age approaches the limit, that is self-selection. The fact that replies fall even harder says the response on the other side of the wall changed too.
But this evidence carries three boundaries, and the paper writes all of them itself. I will not leave any out.
First,this is not a randomized experiment. The paper is observational data plus a discontinuity design. It containsnoaudit study of the kind where the same resume gets a different birth year; audit studies (Lahey 2008, Neumark et al. 2016,) appear only as background literature, and that kind of experiment is not this paper.
Second,the design only covers the postings that state an age cap; the large majority are outside the discontinuity identification (the count comes next section).
Third,the drop at the cutoff mixes in applicant self-selection, so part of the “reply rate decline” may come from a changed applicant pool rather than different treatment of comparable applicants. The paper’s handling is to add controls and assume thatunobservable characteristics are balanced across the cutoff— an assumption that cannot be tested directly, and I will not round it off for them.
On robustness: bandwidth choice, dropping observations near the cutoff, and measuring age distance in quarters instead of months all leave the conclusion stable . On the identification assumption, the applicant age distribution issmooth with no bunchingat round-number ages such as 30, 35 and 40, which the authors take as reassurance that neither age misreporting nor selective entry threatens identification . That is the authors’ evidence; I did not recompute it.
The gate does work. So how many postings put it in writing?
4. The gate written on the page

A posted age cutoff is, in plain words, the age requirement written straight into the job ad. The paper identifies it by extracting phrases such as “under X years old,” “below X years old,” and “aged X to X” from job descriptions . What comes out (; Table 1):
- 14.9%of postings state an upper age limit,with an average cutoff of 36.3 years;
- the most common threshold is 35, accounting for36%of postings with age restrictions — the paper calls this China’s “35-year-old phenomenon”;
- 5.9%state an age minimum,68.8%state an experience requirement, and70.4%in total carry an explicit or experience-implied minimum age.
So the design in section 3 covers exactly those 14.9 percent —the other 85 percent of postings are outside the discontinuity identification, and that is the denominator anyone quoting the 17 percent has to carry along.
The third bullet was the one I had not thought about. I used to think the age gate was that line reading “under 35.” In factmore of the gate sits in the experience column: a requirement of “three or more years of experience” shuts out people who are 21 or 22, only nobody calls it an age limit.
Postings also get priced by rung: the average stated cap is 39.9 years for managerial postings against 35.0 for entry-level (Table 1) — the higher the rung, the older the writing allows. Managerial postings also ask more often for evidence of having been proven: requiring a positive performance signal (management experience at foreign-invested or state-owned firms, or team leadership) runs at 11.5 percent overall, only5.7 percentfor entry-level, and23.6 percentfor managerial; split by experience requirement, this rises monotonically andreaches 45 percent for postings requiring more than 10 years of experience.
One number discipline to flag first: the paper’s prose rounds these to “6 percent / 69 percent / 70 percent / 15 percent,” while Table 1 gives 5.9% / 68.8% / 70.4% / 14.9%. This article uses the precise values throughout.
So close to one in seven postings puts it in writing, and seven in ten carry an explicit or implied floor. What about the postings that write nothing at all?
5. Postings without a written gate behave the same — with a discount
Only a minority of firms state an age limit. What about the rest? The paper splits positive response rates for entry-level jobs into two groups, with and without a stated maximum (Figure 2a,). The two curves arenearly identical: bothpeak at age 25and decline at a similar rate afterwards; the group with stated limits has a higher overall response level, but the shape matches.
That is a sharp result:the written gate may be just the part of the iceberg above water.
The paper writes “Although this evidence is descriptive” in the same breath —this is descriptive evidence. It does not carry the weight of the discontinuity estimate in the previous section: that estimate has an identification design, this one just puts two curves side by side. The paper goes on to say that many firms act on age-based preferences even when they do not state them, and I will quote that sentence with its qualifier attached.
One detail I did not expect: even restricting to applicants over 25, each additional year lowers the reply rate for entry-level applications by0.6 percentage points morethan for managerial applications (η₃ = −0.006,), andafter age 30 the reply rate for entry-level applications falls sharply.
That closes “does the gate do anything.” The next question: what did the two sides it separates actually pay?
6. Every rung on the ladder has its own price
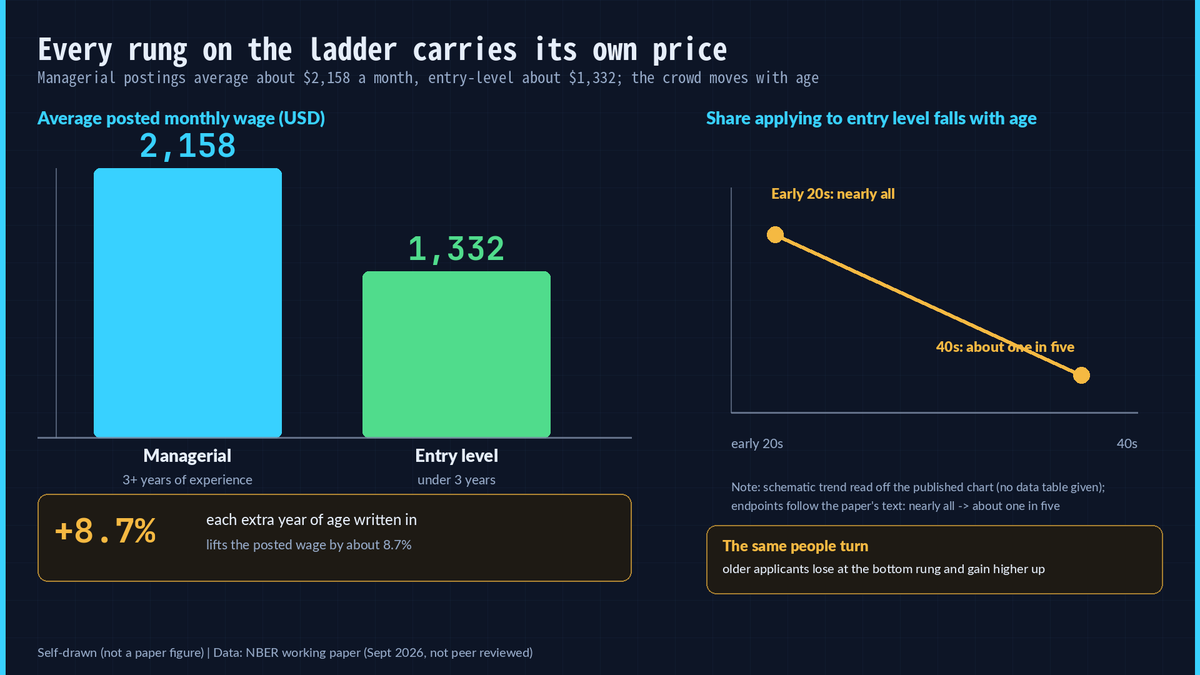
The average posted monthly wage the paper reports (Table 1):$2,158.24 for managerial postings, $1,332.20 for entry-level, $1,600.06 overall. Applications per posting differ too: 26.4 overall, 24.1 entry-level, 31.4 managerial.
Three coefficients from the wage regression (Table 2,): managerial0.371, positive signal0.258, andeach additional year in the minimum age requirement is associated with an 8.7 percent higher posted wage. The last one is where I stopped — the age gate is bound up with higher pay. It is not only a screening device, it is a price tag.
The application mix turns with age (, Figure 2b):nearly all applications from workers in their early twenties target entry-level positions, a share that falls to around 20 percent by the forties. Read backwards: older applicants put more and more of their chips on managerial roles.
Here is an association of my own, outside the paper, flagged as my guess and not something the paper tested:the turn in the application mix is itself a form of self-protection. Older applicants know entry-level roles are hard to land, so they aim higher; but the ticket upward (positive signals, three or more years of experience, 45 percent of postings asking for proof in the ten-plus-year band) is exactly what is hardest to assemble. Squeezed from both sides, you get the two-sided result in the next section.
7. The other end: being young is not a free pass
Run the “you lose as you age” intuition in the other direction and the paper’s claim holds both ways: managerial postings are effectively harder for younger applicants to get into (abstract;).
The reason is in the structure: managerial jobs pay more on averageand typically require evidence of past success— promotions, or strong performance in demanding roles . Meanwhile the definition of entry-level is itself “under three years of experience.” So when age and job do not line up, both ends hit a wall.
One term I have to make plain here:statistical discrimination, in everyday language istaking the average impression of “how people this age tend to do” instead of looking at the person. The paper’s model says this behavior grows naturally out of the structure — employers read productivity from the interaction of applicant age and job type .
So what does the average person still standing in the entry-level line look like? That is the most counterintuitive section in the paper.
8. The ones still in the line earned less before
The paper usesprior wageas a stand-in for productivity — in plain words, the monthly pay at your last job, and the paper states itself that this is a proxy . Two numbers, do not mix them (, Figures 3b/3c):
- older applicants who still apply to entry-level roles had prior wages about 20 percent below same-age peers applying to managerial roles, with the gap widening slightly with age;
- about 16 percent below the regression-adjusted average for their own age group.
The first ruler is “same age, different destination.” The second is “same age, everybody.” Reporting either as “older workers earn a fifth less” is wrong.
Adverse selection, in plain words, isthe people still standing in this line are on average the ones already skimmed off. The paper’s mechanism story is blunt: an older worker applying for an entry-level job isa residual from a pool that has been repeatedly skimmed— at every career stage the higher-productivity workers sorted away, leaving those who failed to accumulate qualifying signals .
Three more pieces support that reading: first, the decomposition shows managerial applicants are positively selected on both theobservable component(college selectivity, top-tier university, gender, field of study, graduation cohort) and theresidual component, so the gap is not driven only by pre-market credentials (footnote 14,); second, two other quality proxies (a classification from the applicant’s application portfolio, and current employment status on the platform) give qualitatively identical conclusions ; third, the managerial-minus-entry prior wage gap is positive at every age (Figure 3a).
Here I have to brake myself:16 percent and 20 percent are correlations, not a causal measure of productivity— the paper itself writes prior wage as a proxy. Reading it as “older workers are less capable” is over-reading; the paper’s point is that the average quality distribution of whoever is still in the line differs.
So what is the employer actually doing? The paper offers two explanations, and admits it cannot tell them apart.
9. Two explanations, and the paper says it cannot separate them

The first istaste-based discrimination— in plain words,simply not wanting a group, with no link to productivity at all.
The second isstatistical inference(the paper’s own phrasing: reading productivity from the interaction of age and job type), together with the adverse selection just described —using age to stand in for ability, while the people still at the back of the line look weaker on paper.
In its conclusion the paper writes, in its own words: “Our analysis does not rule out other explanations for discrimination. Ageist stereotypes and taste-based preferences likely account for an important share of what we observe.”This sentence is the boundary this episode has to carry alongside the results— it is not my added suspicion, it is what the authors wrote.
Two more follow from it: first, when signals are noisy or imprecise,some highly productive older workers will be unfairly disadvantaged; second, a labor market that both reveals and rewards productivity also meanssome people inevitably get left behind.
So my reading of this figure is:these two explanations are not either-or. This episode is about what the gate filters, not about which motive explains every rejection. The paper itself does not separate them — it gives structure and evidence, and leaves the attribution open.
That closes the critical part. What is left are the doubts I kept after reading.
10. Three doubts I kept after reading
The paper shows thatstated age caps and employer behavior together form a binding constraint; what it does not show needs saying too:
1.The blind spots are wide.One province, Guangdong; applicants only to 45 — and the people furthest downstream of a 35 threshold, the ones who most need to be seen, are exactly those the sample misses. The discontinuity covers only the nearly 15 percent of postings with a stated cap; the rest are read from curve shape alone. 2.The gate is not randomly assigned.The drop at the cutoff mixes in applicants who stopped applying on their own, and identification rests on the assumption thatunobservable conditions are comparable across the threshold— one no test can confirm. That is this design’s built-in limit, and anyone quoting the result has to carry it. 3.The prior wage gap is correlation, not causation.Prior wage stands in for ability, the amounts are the dollar means the paper reports, and the exchange rate and construction are not spelled out in the text.
One reminder: this is a working paper, not peer reviewed — do not cite it as published literature.
Cold water poured. Back to you and me.
11. If this concerns you
The three layers below are what I read out of the results,not the paper’s conclusions— it gives no personal advice.
1.No reply does not mean you are not good enough.At the threshold, applications fall 17 percent, employer replies fall nearly 20 percent, and an individual’s reply probability is about 5 percentage points lower: that is a gap in the structure, not a score of your ability. 2.Read the ticket before the posting.Seven in ten postings carry an explicit or implied minimum age, most of it hidden in phrasings like “three or more years of experience”; that tells you more than staring at the age line. 3.The ticket upward is “having been proven.“Among postings asking for more than ten years of experience, 45 percent require a positive performance signal — the time scale for assembling that evidence is longer than any single year of age.
For the people writing job ads, the only takeaway is also this structural layer: the stated gate is just the part above water. As for how to change it, the paper offers no scheme.
Back to the opening: the line on the posting filterspeople whose age does not match the job — it blocks at both ends; the part written down is only a minority. Age is not a scale for ability, but on the ladder it gets used as the checklist at the door.
Source: Signals, Steps, and Setbacks (NBER Working Paper 35709, 2026-09, DOI 10.3386/w35709) | working paper, not peer reviewed | fig01–fig04 are entirely self-drawn; no figures from the paper.