
Whenever someone in my family falls ill, an old rule comes out of the kitchen: no sugar. It has always sounded like household experience rather than evidence. The question I was stuck with before I opened this paper is a plain one:during those days on antibiotics, how much can one sweet thing actually do?Until now the answer I could get was “probably something”, and this paper answers it with meal-by-meal accounting.
The answer is a two-step picture: antibiotics push the good bacteria in the gut down and free up the space, and sugar then feeds the genus that is best at taking territory into that vacancy.Sugar never acts alone. What it waits for is the clearing step.
Here are the numbers first. 173 hospitalised patients, 9,419 meals accounted for one by one, 158 of them with paired microbiome samples. After exposure to broad-spectrum antibiotics, every extra portion equal to 100 g dry weight of sweets and sugary drinks predicts an additional24.1%drop in bacterial diversity (95% credible interval 7.7–38.1%). The mice are blunter: with the same antibiotic, the sugared group pushed that genus’s expansion from16.3 timeson day 3 to33.4 timeson day 6.
For an ordinary reader the use of this study is narrow but clear: for those days, take the sweets and sugary drinks off the table, keep eating whole fruit, and follow your doctor’s advice on everything else. Before going further, pin down what this study is, because it decides what every number below is worth —Nature (2026), DOI 10.1038/s41586-026-11077-3, a paper published in Nature and already through peer review; it is not a working paper, and it should not be inflated into a “clinical verdict” either. The sample is severely ill inpatients receiving a stem cell transplant at a cancer centre in New York; the human part shows correlation only, and the causal part lives in mice. Treat it as a research finding rather than medical advice.
I. 9,419 meals, ticked off one at a time
Start with how the meals were recorded, because it decides whether any of the numbers below are worth reading. This was not a questionnaire and not recall. The hospital kitchen’s catering system printed an itemised list with the tray, and after each meal the patient ticked how much of every item was eaten: 0%, 25%, 50%, 75% or 100%. A dietitian went to the bedside three times a week to collect the forms and fill in gaps, and a research dietitian then went through the data by hand, dropping obvious calorie typos. Eating habits before admission were never surveyed; only what went in during the stay counts.
The scale: 173 patients, 9,419 meals, 40,702 food items. The lightest recorder logged 8 meals, the heaviest 128 — an enormous spread. On the microbiome side there are 1,009 stool samples from 158 of those people, a median of 5 samples each. The bacteria were counted with 16S sequencing — you read a stretch of bacterial DNA that differs between species and tally which types are present in the sample. It is the most basic counting tool in gut research, and it is worth naming once precisely because everything later rests on it.
Who these people were also has to be said out loud: adult blood-cancer patients enrolled between 2017 and 2022 at a cancer centre in New York, all about to receive a haematopoietic stem cell transplant. That treatment opens with intensive chemotherapy, and painful mouth and throat lesions, nausea and loss of appetite are common — which is exactly why “what did you eat” is not a small question in this group. It is also why every number here belongs to this setting alone and cannot be carried over to an ordinary person’s dinner table.
The antibiotic convention needs stating too. All 173 patients received at least one antibiotic during the dietary collection period, usually starting with prophylactic fluoroquinolones and intravenous vancomycin; 138 of them (80%) were switched to broad-spectrum antibiotics when fever or signs of infection appeared. In the model, “antibiotic exposure” means only the six broad-spectrum drugs taken in the 2 days before each stool sample was collected — the two prophylactic ones do not count. That 2-day window was chosen deliberately: widening from 1 day to 2 days improved the diet–microbiome fit the most, and it matches how long the human gut takes to move food along.
I had assumed this kind of study runs on patients’ after-the-fact memory. Seeing “tick 0/25/50/75/100% on the spot” is what showed me where it is harder than a questionnaire — memory smooths the sweets away, an immediate tick does not. The accounting layer holds up, but the odd part is not here.
II. The antibiotic clears the room, the sugar hands over the blade
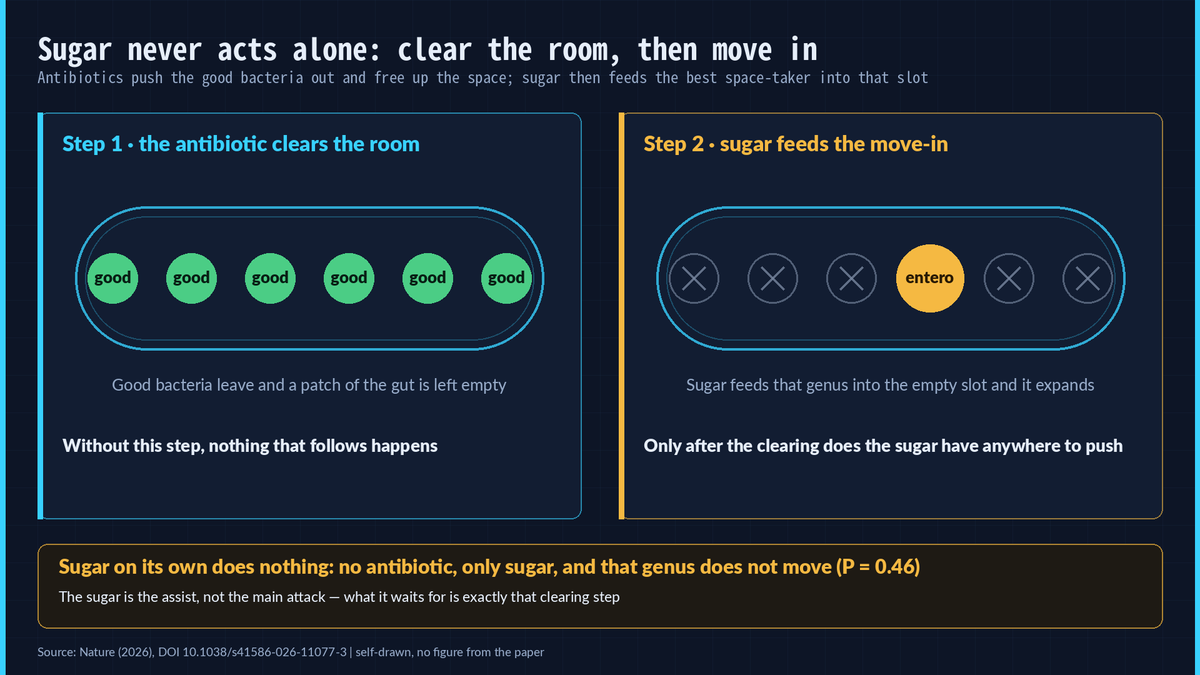
The mechanism the paper proposes has two steps, and the picture above is its plain-language version. First, broad-spectrum antibiotics push down the bacteria already living in the gut and the ground is vacated. Second, the sugar consumed at that point becomes food for a certain genus, which grows straight into the open slot. Sugar on its own does nothing: no antibiotic, only sugar, and that genus does not move at all (P = 0.46). The clearing step is the precondition; the sugar is what follows it.
One thing here runs opposite to clinical habit:sugar-enriched oral nutritional supplements are already a standard recommendation for transplant recipients, and the paper’s own word for the result is “surprising”. The researchers then re-cut the data at a finer resolution and found the key contributors were formulated nutritional beverages — sports drinks, nutritional shakes — plus added sugars rather than the sugar that occurs naturally in food. What is supposed to go in as nutrition happens to carry sugar; the paper says this out loud, and as for how to weigh that in the clinic, the paper does not answer it and neither will this article. In that routine, sugar is not a snack; it is part of the supplement, and how much weight it carries in the data is a question for three numbers.
III. Three numbers measured in people
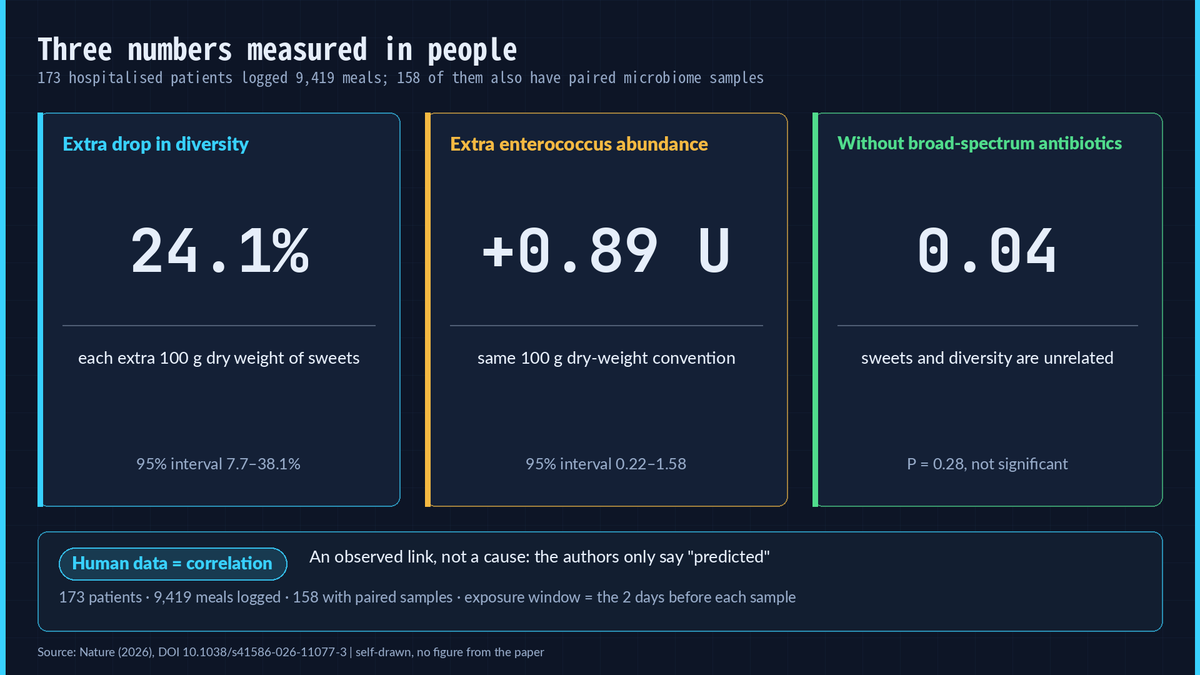
The three cards above are the entire core of the human layer. The first number: after broad-spectrum antibiotic exposure, for every extra portion equal to 100 g dry weight of this category, the model predicts bacterial diversity drops an additional24.1%, with a 95% credible interval from 7.7% to 38.1%, compared against samples with no previous antibiotic exposure. The interval is not narrow, which is why the paper’s verb stays “predicted” and never “caused”.
The second number: in the same patients and on the same 100 g dry-weight convention, the relative abundance of the genus most likely to expand when things go out of balance — enterococcus, grouped by genus — is0.89 unitshigher, with a 95% credible interval of 0.22 to 1.58. The more it expands, the further the community shifts towards a structure where a single bacterium is in charge.
The third number is the one that matters. Among samples with no broad-spectrum exposure, the grams of this food category and bacterial diversity are barely related at all: a correlation of0.04, P = 0.28, close to zero. In the exposed samples of the same dataset the correlation is −0.2 (P < 0.01). When sugar is present by itself the water is still; only once the antibiotic has struck does it move along with it.
One sentence on the method is enough: this kind of analysis uses a Bayesian multilevel model — a probability model that takes “the same person sampled repeatedly” and “week-to-week time differences” into account, and outputs an interval rather than a bare point, so patients sampled frequently cannot dominate the group estimate. Run it again on a macronutrient convention and the antibiotic-by-sugar interaction is still an extra 20.6% drop per 100 g (95% credible interval 2–35.6%), same direction.
My read is that 0.04 deserves more attention than 24.1%, because it says sugar has never been the one acting on its own. 0.04 and 24.1% are saying the same thing: sugar is only waiting, waiting for the antibiotic to move first.
IV. Only the mice can carry a causal claim
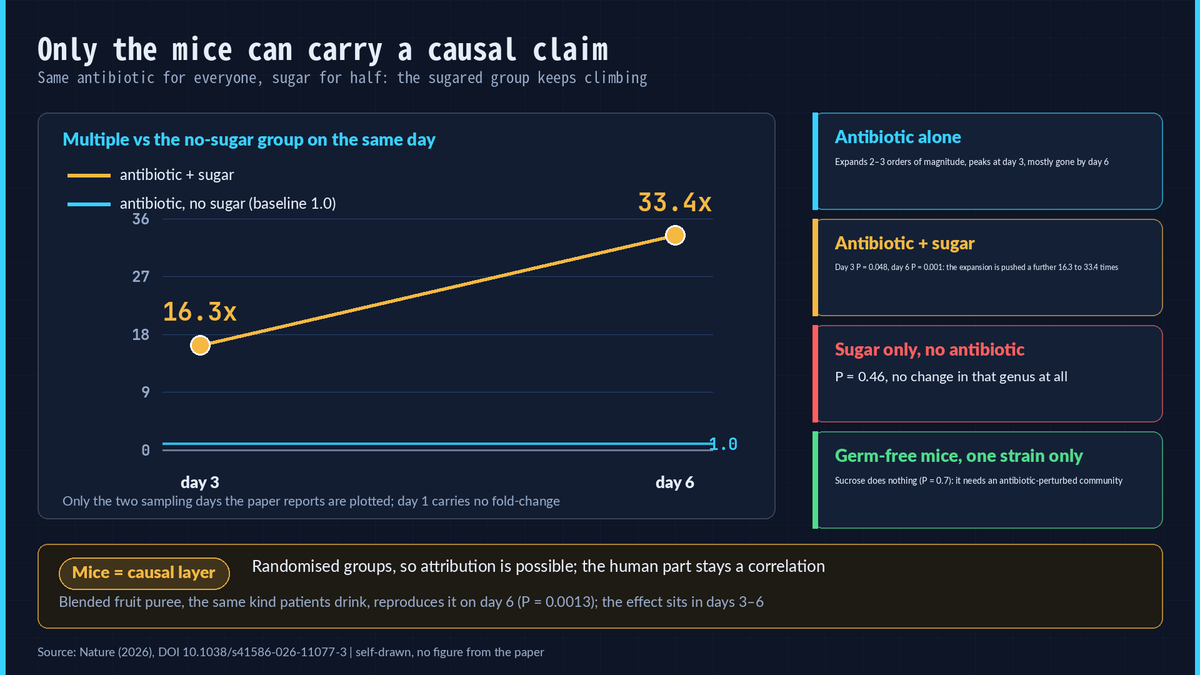
If “sugar is only waiting” is to move from a judgement to a conclusion, only one other method will do: randomise. The researchers gave mice a single injection of a carbapenem antibiotic and split them four ways — injected or not, sugar or no sugar — sampling on days 1, 3 and 6. In the antibiotic-only group that genus first expands 2 to 3 orders of magnitude, peaks on day 3 and is largely gone by day 6. In the sugared group, on the same antibiotic, the expansion is pushed to16.3 timeson day 3 (P = 0.048) and33.4 timeson day 6 (P = 0.001). Randomised groups, attributable — this is the only layer in the paper that dares use the word causal.
Three counter-tests close it off. First, sugar without antibiotic: no change in that genus at all (P = 0.46). Second, empty the mouse gut of bacteria entirely and colonise it with a single strain, and sucrose no longer pushes anything (P = 0.7) — in plain words, the sugar needs a complex community that an antibiotic has disturbed, and a single strain on its own is nowhere near enough. Third, the sugared mice ate about the same amount and their weight did not move (food intake P = 0.31 / 0.84 / 0.55), which blocks the “they simply ate less” explanation.
Several sugar forms were tested: sucrose, glucose and fructose are all significant on day 3, but by day 6 only sucrose still is; blended fruit puree — the same kind of smoothie patients drink — reproduced the effect on day 6 (P = 0.0013). In the 21-day series the effect sits in days 3 to 6 and is no longer significant from day 9.
Causality holds in the mouse layer, and still the word “sugar” in this whole story has never been pinned down.
V. What counts as sugar here
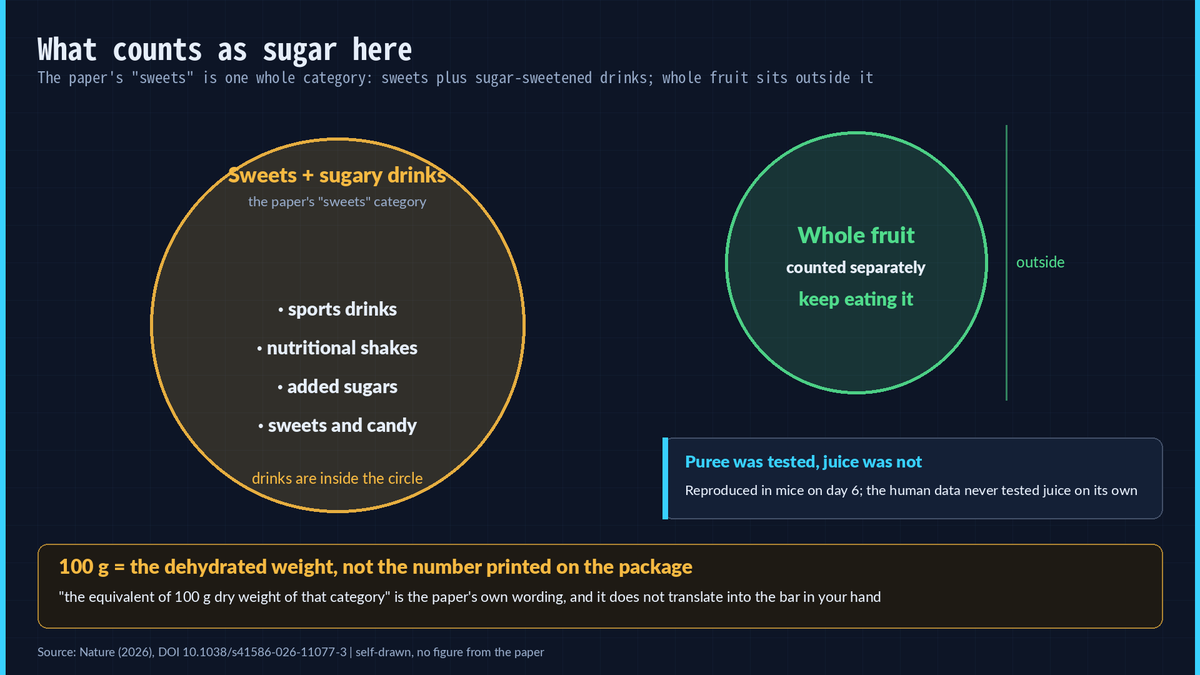
“Sweets” in this paper is not a casual phrase; it is an entire category in the US food classification: sugars, sweets and beverages. Sugary drinks, nutritional shakes and sports drinks are all inside it, so removing sweets in this paper also means removing sugary drinks.
Whole fruit is not in that category. The paper lists fruit as a separate, parallel class and models the two separately. What comes off the table is the sweets-and-sugary-drinks class; fruit stays. Mixed fruit puree has to be described separately: it was tested in mice and reproduced the effect on day 6, but the human data never tested juice on its own, so “juice definitely makes it worse” is a claim the paper cannot carry, and this article will not write it.
One more trap: the 100 g here is theweight after water is removed— the paper subtracts the water from every food by its composition table and then adds up. It is not the number printed on the package of the bar in your hand, and it is not the volume of a full glass. The correct reading is “the equivalent of 100 g dry weight of that category”, and forcing it into everyday portions only produces a wrong answer.
With the convention nailed down, the most awkward thing in the paper finally surfaces — not that patients snuck snacks, but that the routine meant to add nutrition already carried sugar in it.
VI. The sugar that was supposed to be nutrition may be adding to the damage
Open up the diet records and the key contributors are sports drinks, nutritional shakes and added sugars. Across the whole stay, calories and nearly all nine food groups slide downward, and the one class that does not follow is “sugars, sweets and beverages”. These patients were not sneaking between meals; some of them were supplementing their nutrition exactly as the clinic had told them to.
My judgement is that the sharp edge of this paper sits in that contrast rather than in the 24.1%. The natural assumption would have been “sick people crave sweets”, and the data give a colder picture: the routine of supplementing nutrition carries sugar with it, and the antibiotic is working on the same people at the same time. This judgement goes beyond what the paper measured and is my own association — the paper never tested “what if the supplement were sugar-free”.
To be clear, sugar is not the main cause either. Even with diet in the model, a large share of microbiome disruption stays unexplained; the slope between dietary change and microbiome change is only 0.6, and the rest has nothing to do with what was eaten. The paper’s own positioning is careful: this is amodifiable amplifierand never the source. Whether it has anything to do with living or dying is a different line of evidence altogether.
VII. The line that touches death can only say correlation
The paper did look at death. It split people in half at the median sugar intake, kept only those alive on day 12, and estimated the death risk ratio for “each additional day of broad-spectrum antibiotics”.
The high-sugar group shows a risk ratio of1.12(95% CI 1.01–1.23, P = 0.027), which is statistically meaningful; the low-sugar group shows1.07(0.96–1.19, P = 0.23), which is not significant. Take antibiotic exposure out of the picture and the two groups have comparable mortality — a multivariable risk ratio of 0.72 (0.18–2.85, P = 0.6). In other words, eating more sugar by itself does not line up with how long someone lives; what lines up is the combination of sugar with days of antibiotics.
The second cut, grouping people by dietary pattern, behaves the same way: the cluster with a higher share of sugar has a risk ratio of 1.11 per additional antibiotic day (P = 0.024), the other cluster 1.06 (P = 0.36), while the survival difference between the two clusters is not significant on its own (logrank P = 0.088).
Three discounts apply here. First, splitting at the median throws away information. Second, the paper states outright that these survival P values were not corrected for multiple comparisons, while reporting several sets of results at once. Third, sugar intake is strongly correlated with total calories, and on a calorie-adjusted convention the sign can even flip. So this line stops at correlation: it tells us the risk reading moves when the two things occur together, it does not tell us which of the two is doing the work, and it certainly cannot be read as “eat less sugar and you will live longer”.
VIII. Who these patients are, and how far the claim can travel
First the sample boundary, which in any retelling must sit on the same screen as the numbers: one cancer centre in New York, enrolled between 2017 and 2022, adult blood-cancer patients, receiving a haematopoietic stem cell transplant, hospitalised and severely ill. The first limitation the authors list themselves sits right there — prophylactic fluoroquinolones were used by nearly everyone, so this interaction reflects “dietary intake in the context of escalation to broad-spectrum antibiotics” more accurately than any antibiotic by itself.
Second is confounding. Broad-spectrum antibiotics get called in when fever and signs of infection will not wait, so the medication is tangled up with how sick the patient was; the authors also concede that the raised mortality risk could in part come from lower food intake. Third is time-varying confounding: transient symptoms change appetite, and food eaten outside the ward is not fully recorded. Fourth is extrapolation — the authors’ own closing position is that these results need replication in independent cohorts, that prospective trials are needed before any conclusion, and that their own action wording is only “may mitigate”.
Several self-disclosures belong on the table too: the human cohort had no formal sample-size calculation, the mouse work was not blinded, used females only, and sized animals on preliminary data, and the survival tests were not corrected for multiple comparisons. All of this is written into the paper’s own reporting summary rather than being an outside attack, but together they decide how much confidence these numbers deserve.
One more aside: the analysis code of this paper is released under an MIT licence, the sequencing data sit in public repositories, and the source data are archived with a DOI, so anyone can recompute it. The article text and figures themselves are under CC BY-NC-ND, which does not permit sharing adapted material — which is why all four figures here are drawn from scratch, with no figure from the paper.
These boundaries do not overturn the paper’s findings; they only label each number with the confidence it should carry. And who that sentence from the opening can be spoken to is decided by exactly these boundaries.
IX. Those days: what comes off the table, what stays
Back to “no sugar” from the opening. For the first time this paper gives it meal-by-meal accounting, and for the first time it draws its boundary. What comes off is the sweets-and-sugary-drinks class, over the window the paper actually measured — 2 days before each sample in the human data, days 3 to 6 in the mice; nothing in the paper supports avoiding sugar for the whole course of treatment. What stays is whole fruit, which the paper counted as a separate class to begin with. On food, follow your doctor — that sentence always ranks first.
Research findings, not medical advice; the sample is severely ill inpatients receiving a stem cell transplant, not the general population. The authors call it a modifiable amplifier, and they have already written down the next step: repeat it on another group of people. Those are the paper’s own words.
If you want to check it yourself, the whole paper comes up on the DOI 10.1038/s41586-026-11077-3, and the three numbers 24.1%, 0.89 and 16.3 / 33.4 sit in the human results, the genus analysis and the mouse time course respectively. If a convention does not line up, or you want me to take on the next paper, say so in the comments.