
Start with three real failure cases.
Ask a model to shoot a traditional Chinese music performance and the instruments plus the on-screen text have nothing to do with anything actually Chinese. Ask it to shoot a Nigerian wedding and the guests’ clothes and ritual objects look generic, with zero Nigerian flavor. Ask it to shoot a Japanese shogi match and the board and pieces morph straight into Western chess.
The footage itself looks fine. Lighting, motion, sharpness, all in order. That is exactly the problem. Text-to-video is now convincing enough that the more realistic the picture, the more invisible the cultural mistakes become, and the more jarring when you finally spot them. A video made for an overseas market with the wrong costume or the wrong ritual gets sniffed out by a local in seconds: mildly funny at best, offensive at worst.
arXiv 2608.01942, CultureVidBench: Benchmarking Cultural Understanding in Text-to-Video Generation, builds an entire exam around this exact problem: 12 countries, 1,000 prompts, 7 models going head-to-head, all testing cultural understanding in text-to-video. First author Xianjing Han is from Nanyang Technological University, corresponding author Bin Zhu is from Singapore Management University, with Centrale Supélec and the University of Cambridge on the collaborator list. I read the whole thing end to end. Its value is not any single number, it is the first time “does AI understand culture” has been turned from a vibe into a quantifiable engineering problem.
Why Existing Benchmarks Miss the Cultural Layer
Text-to-video evaluation is not short on benchmarks. VBench, EvalCrafter, the usual suspects, have been running for a while, but they stare at image quality, motion smoothness, physical plausibility, prompt adherence. There are dedicated ones for physics common sense, others for robot believability, each covering its own slice.
Culture, on the video side, basically nobody has tested systematically. On the text-to-image side, people have tried. ViSAGe, CUBE-1K, both probe cultural concepts, but a still image tells you nothing about whether the action is right or the audio is right. Culture in video is alive: rituals have sequences, scenes have music, signs have text. That gap is the hole CultureVidBench is built to fill.
The first step in filling that hole is writing the exam, and how good the exam is decides how much you can trust everything that follows. The work this paper put into exam design deserves its own section.
How You Build a 12-Country Exam
Pick the countries first.The authors leaned on the World Values Survey cultural map, a standard academic tool that splits the world into 8 cultural zones such as the Confucian zone, English-speaking zone, African-Islamic zone. They picked representatives from each zone, ending up with 12 countries across 6 continents. Notice the deliberate mix: alongside high-exposure countries with abundant web material like the US, China, and India, they included low-resource countries such as Ethiopia, Nigeria, and Malaysia. As you will see, that mix is what surfaces one of the paper’s most important conclusions.
Then build the prompts.The authors split culture into three big buckets: material culture (food, clothing, architecture, decoration, the things you can see and touch), social practice and performance (greetings, dining, dance, sport, religious activities, what people are doing), and ritual and ceremony (weddings, funerals, full sequences). Those three buckets subdivide into 14 aspects. From each country’s cultural sources they collected 828 cultural elements, eventually polished into 1,000 prompts: 270 on material, 386 on practice, 344 on ritual, with an average of 12.8 English words per prompt.
Human quality control on every prompt.Each prompt is generated from a template. Material culture uses “who + what action + which cultural element + which country,” for example “a woman serving feijoada onto a plate in a Brazilian restaurant.” Ritual items are sequences, so they get broken into sub-activities: a Chinese tea ceremony wedding splits into kneeling to parents, offering tea, and accepting red envelopes. Candidate prompts then pass through two human annotators who check whether the wording sounds natural, the culture is accurate, and the scene is actually filmable.
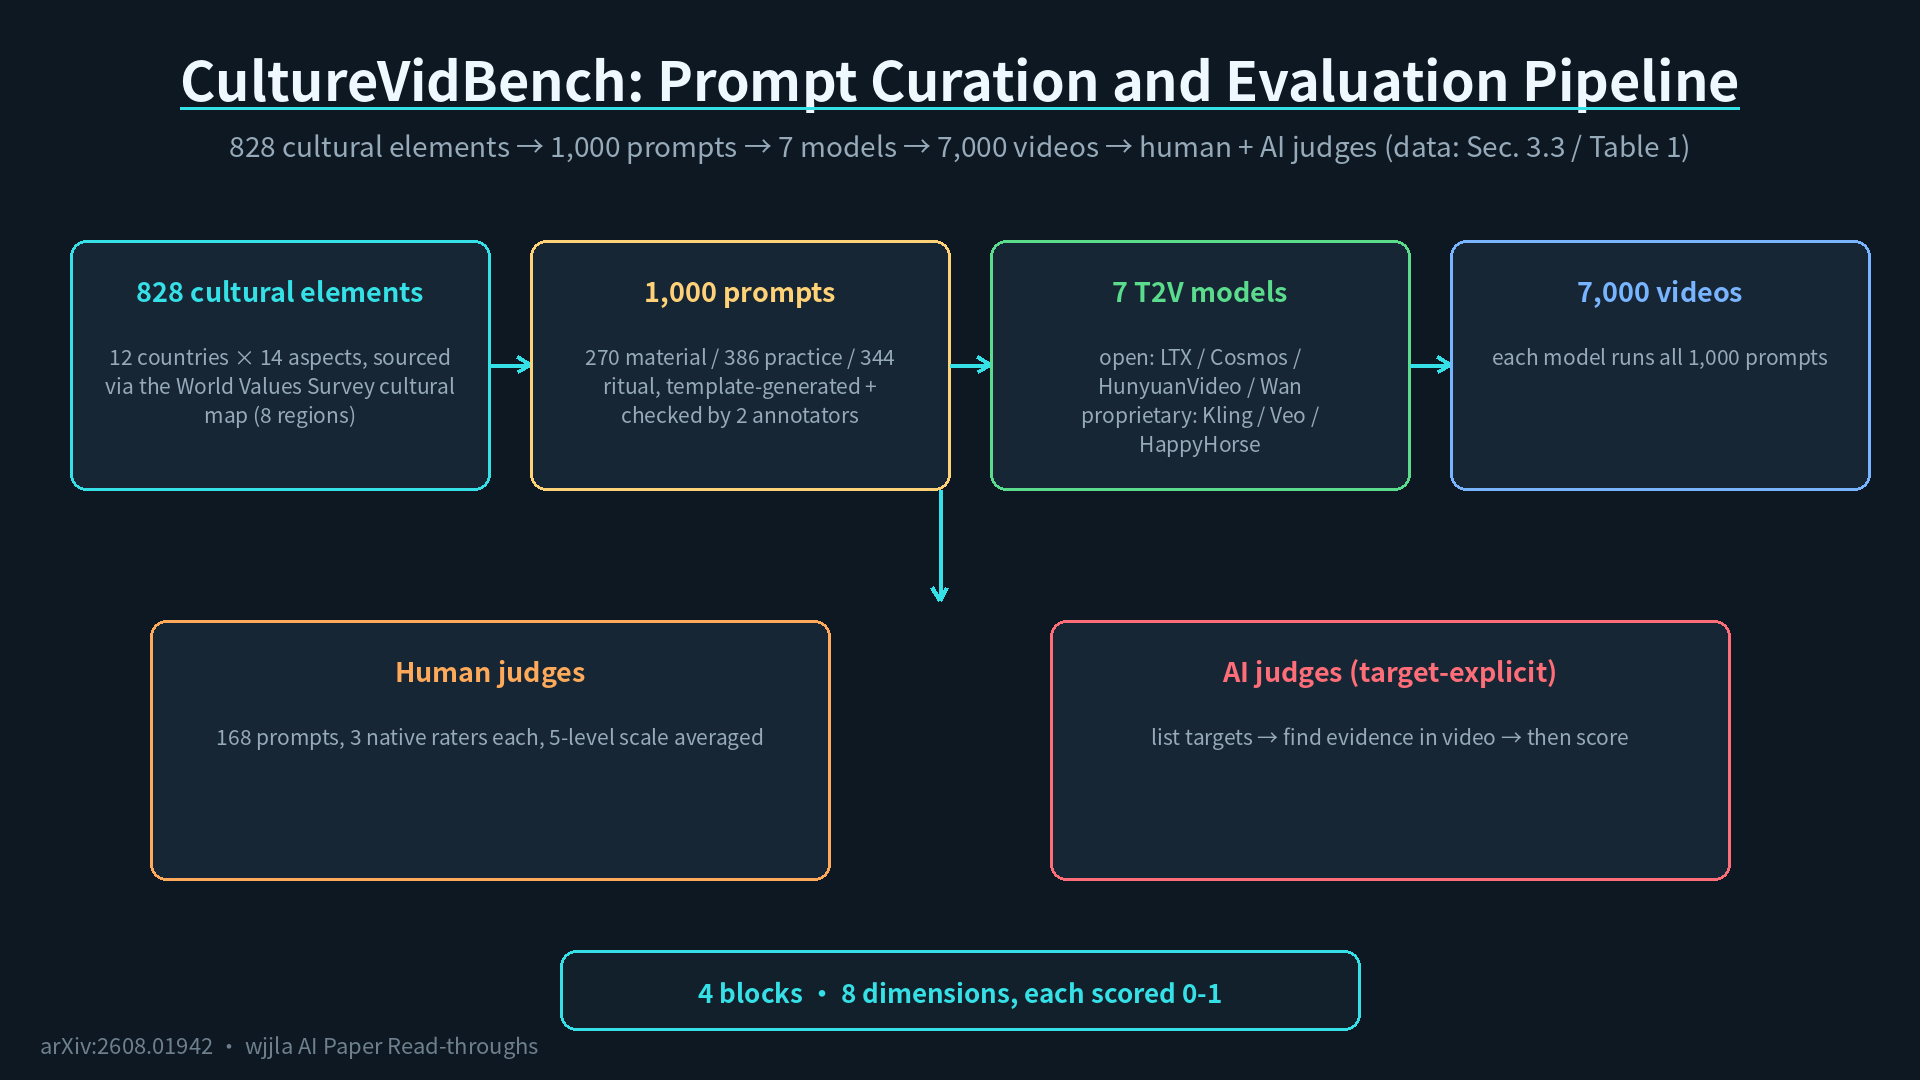
The whole pipeline looks like this: 828 cultural elements become 1,000 prompts, 7 models each generate a video for every prompt producing 7,000 clips, then human and AI judges score them. The test-takers are 4 open-source models (LTX-2.3-22B, Cosmos-Predict-2.5-14B, HunyuanVideo-1.5, Wan-2.2-14B) plus 3 closed-source ones (Kling-3.0, Veo-3.1-Fast, and Alibaba’s HappyHorse-1.0).
How You Score It: Two Big Questions, Eight Small Items
The scoring scheme is clean. Every video answers two big questions:
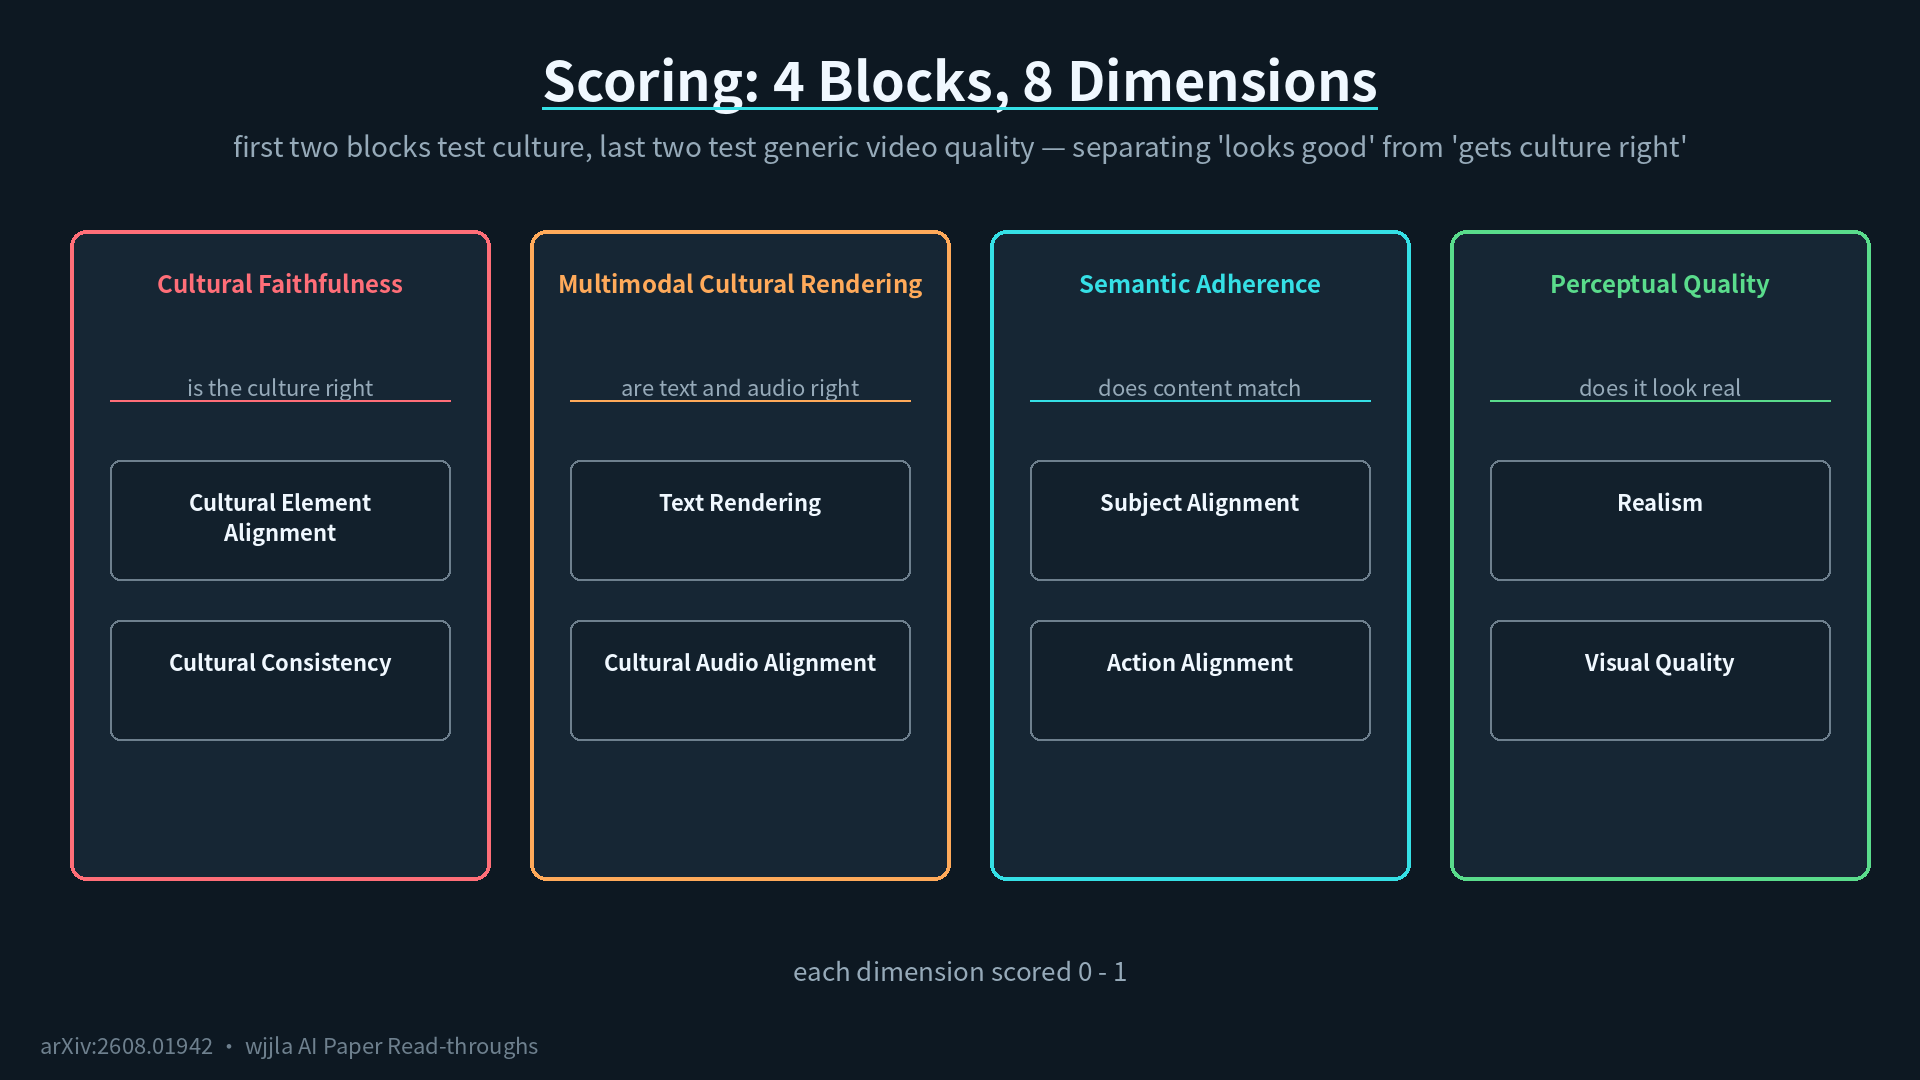
- Did it get the culture right(cultural fidelity): did the expected cultural elements show up (cultural element alignment)? Did foreign elements sneak in (cultural consistency)?
- Is the video itself good(semantic adherence plus perceptual quality): do subject and motion match the prompt? Does the picture look real?
Each item scores 0 to 1. There is also a dedicated section for multimodal cultural rendering: text in the picture, sound in the background. The kanji on a Japanese storefront, the traditional music at a wedding, all live here. Singling out text and sound is the cleverest part of this exam design, and as you will see it is where the worst scores show up.
Two judge panels. Human reviewers graded 168 prompts (14 aspects times 12 countries), 3 local viewers per prompt giving 5-level scores that get averaged. Expensive, but that is the gold standard. The AI judge uses a target-explicit protocol the authors designed, in plain language: do not let the AI grade on vibes. Step one, tell it what the prompt is testing. Step two, have it pull only relevant evidence from the video. Step three, grade based on the evidence. Whether this protocol holds up is something a dedicated table later in the paper tests.
The Scoreboard: A Canyon Between Open and Closed
Table 1 on page 6 is the single most important table in the paper. Start with the human-rated cultural element alignment column:
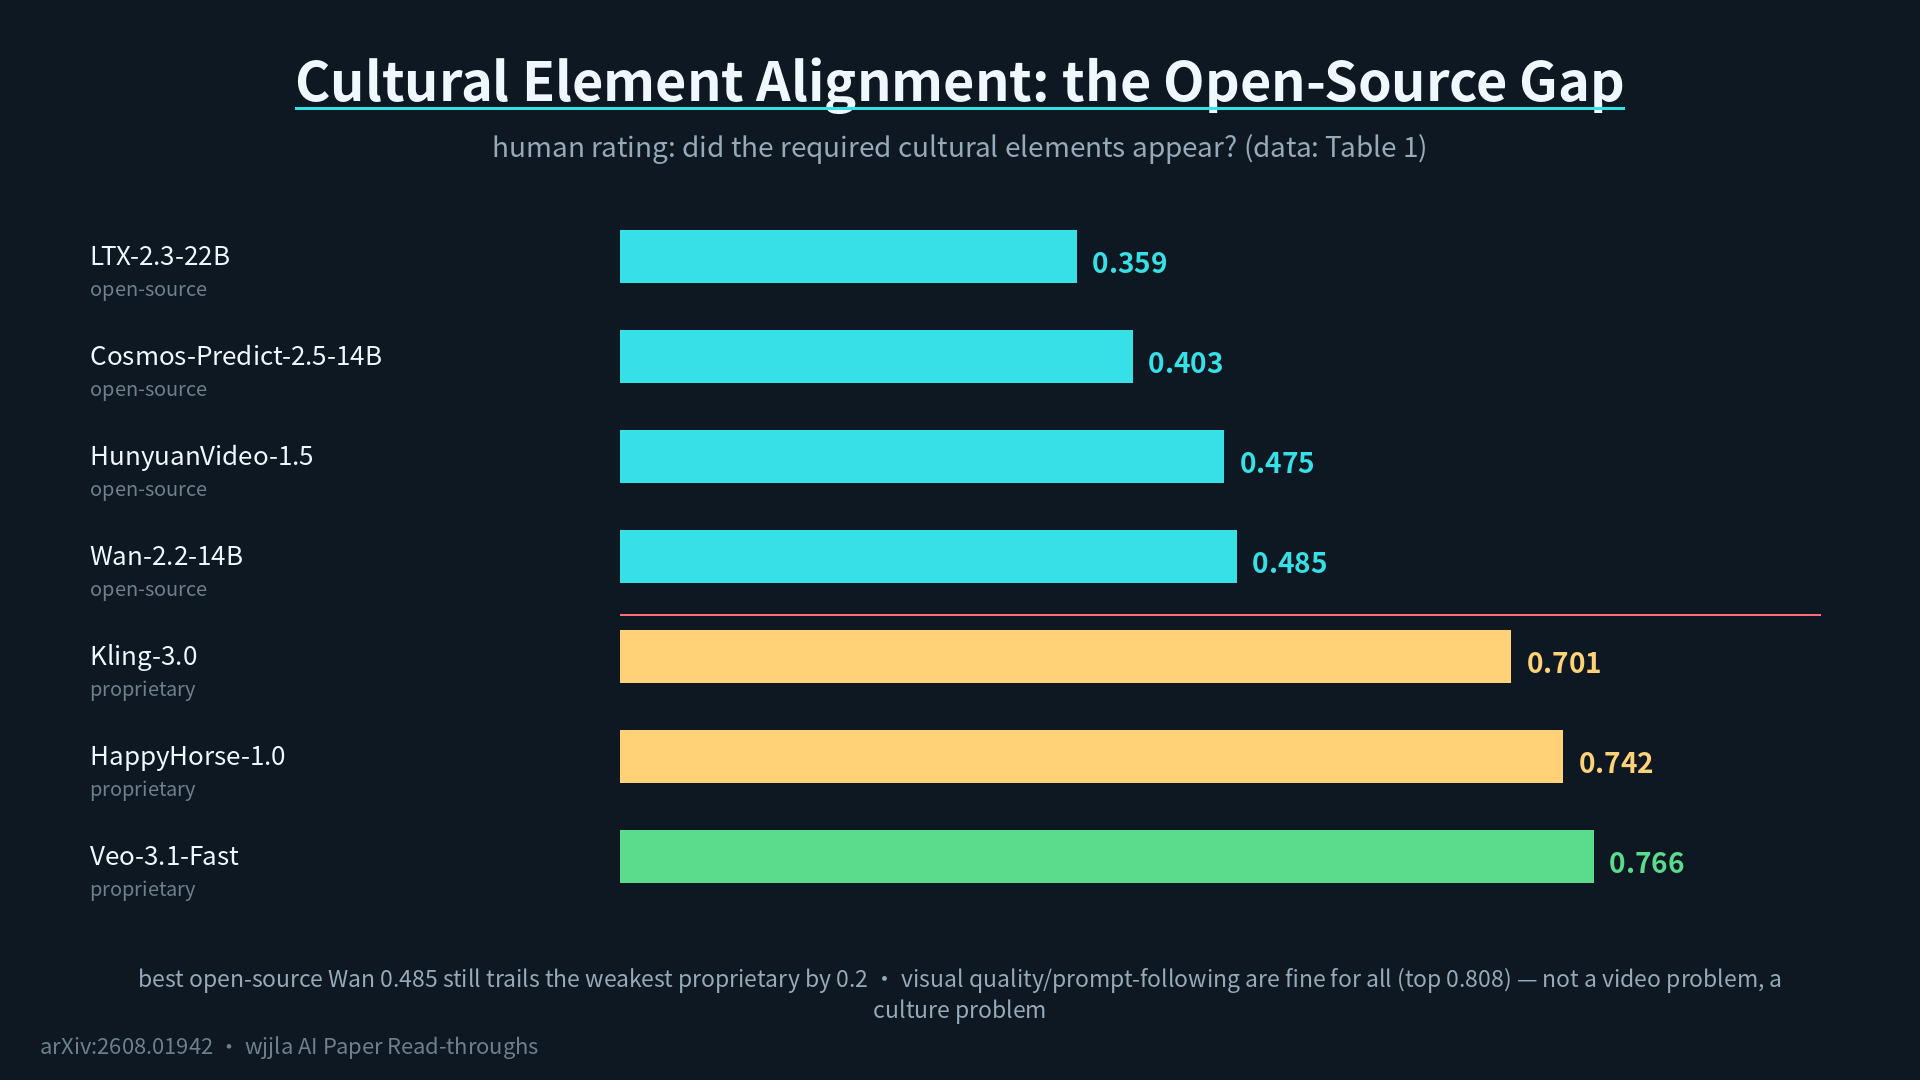
The 4 open-source models all sit between 0.359 and 0.485. The 3 closed-source ones jump straight to 0.701 to 0.766. The top score is Veo-3.1-Fast at 0.766, HappyHorse-1.0 at 0.742, Kling-3.0 at 0.701. The strongest open-source model, Wan-2.2-14B, only hits 0.485, still 0.2 below the weakest closed-source model. A visible canyon.
But the same table hides another key fact: on picture quality and prompt-adherence, these general capabilities, everyone is fine, basically all above 0.49 with the top score touching 0.808. Put the two together and the conclusion is hard:the models are not bad at making videos, they are genuinely ignorant about culture.Cultural gap and generation gap are different problems, and that is exactly why this exam separates them.
The Worst Column in the Room: Text Rendering
There is another column in Table 1 that looks even worse than cultural alignment: on-screen text rendering.
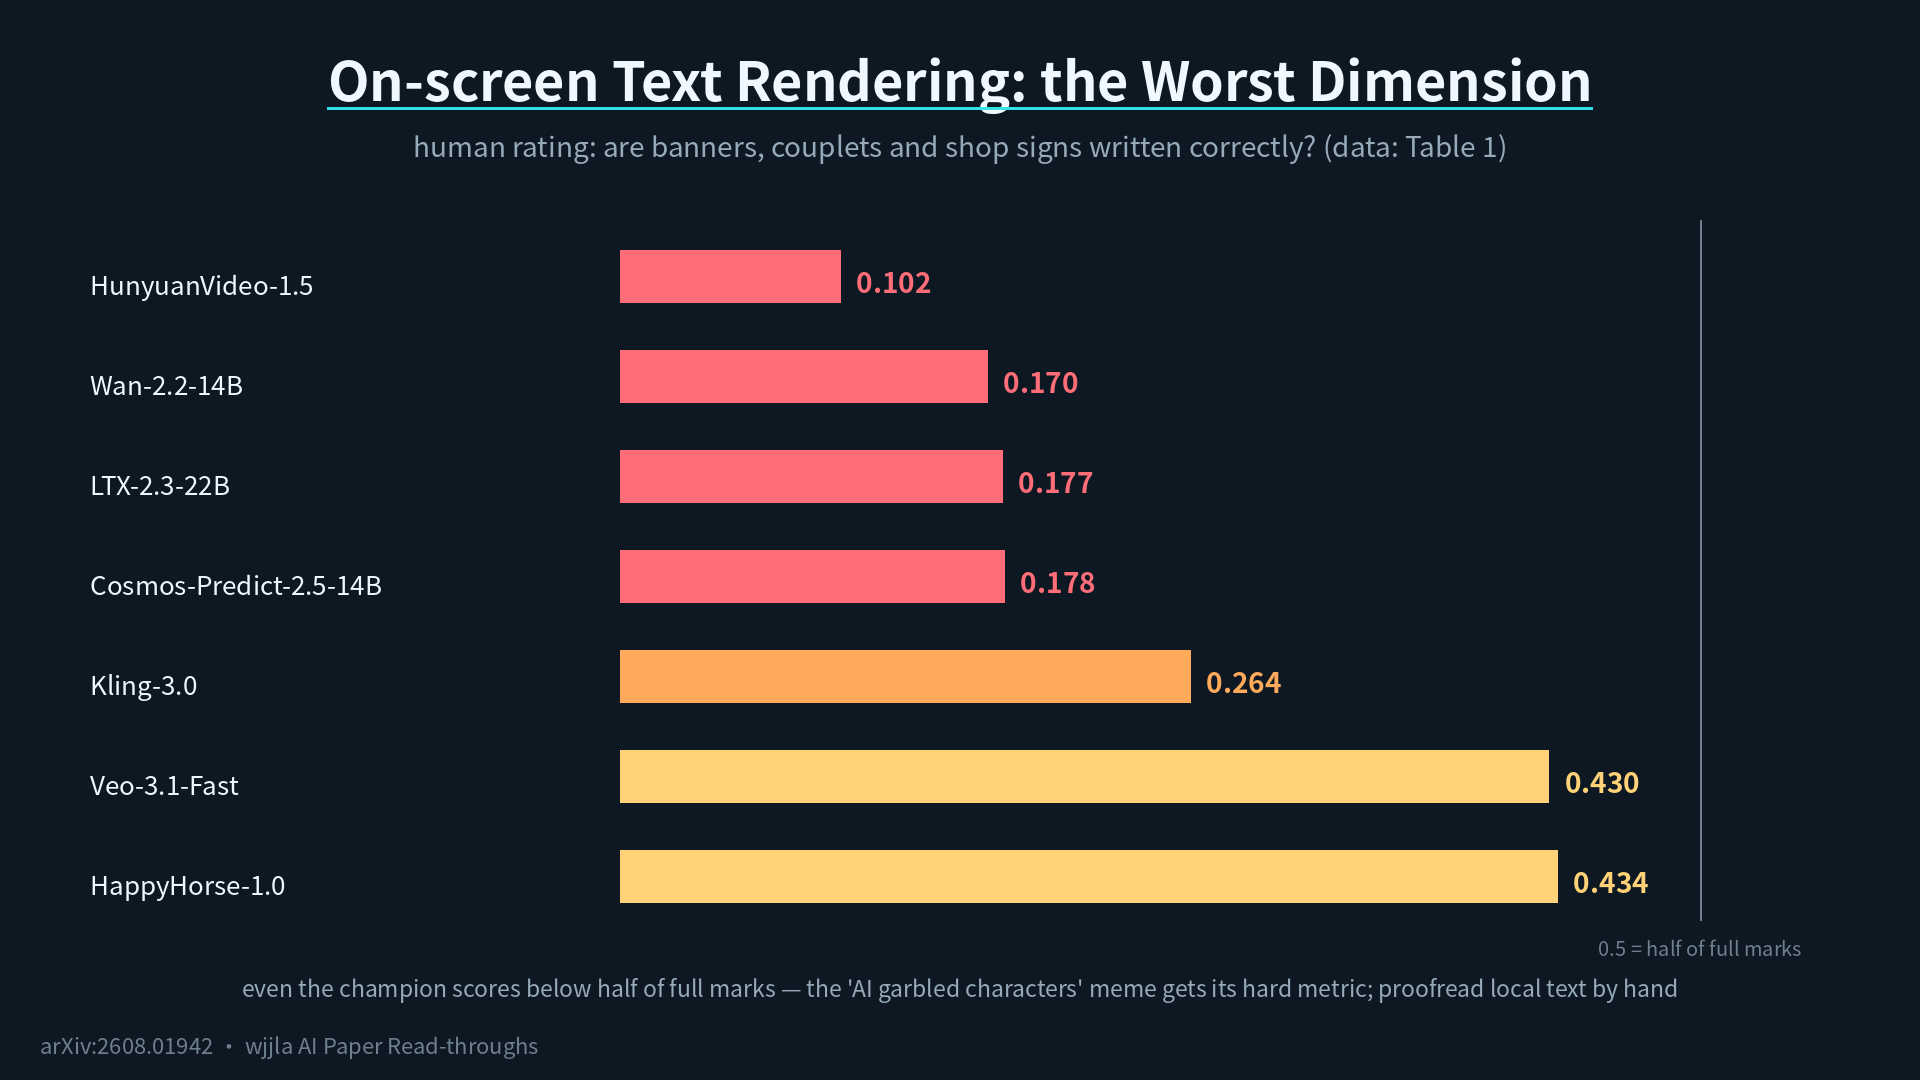
The best open-source model, Cosmos-Predict-2.5-14B, only manages 0.178. HunyuanVideo-1.5 sinks to 0.102. The closed-source group does better, but even the top score, HappyHorse-1.0 at 0.434, is less than half of perfect. Banners, couplets, storefront signs in local scripts: AI basically cannot write them right. The internet folklore about “AI draws text like a demon possessed” now has a hard number behind it. Practical takeaway: any video involving local text needs a human proofreading pass before publishing. No current model covers your back here.
Can AI Judges Be Trusted: The Table 2 Wager
Using AI judges is meant to scale evaluation, since 168 human-reviewed prompts is already heavy spending, but can you trust AI scoring? Table 2 answers that using Kendall’s τ and Spearman ρ on country averages. The closer to 1, the more AI rankings agree with human rankings.
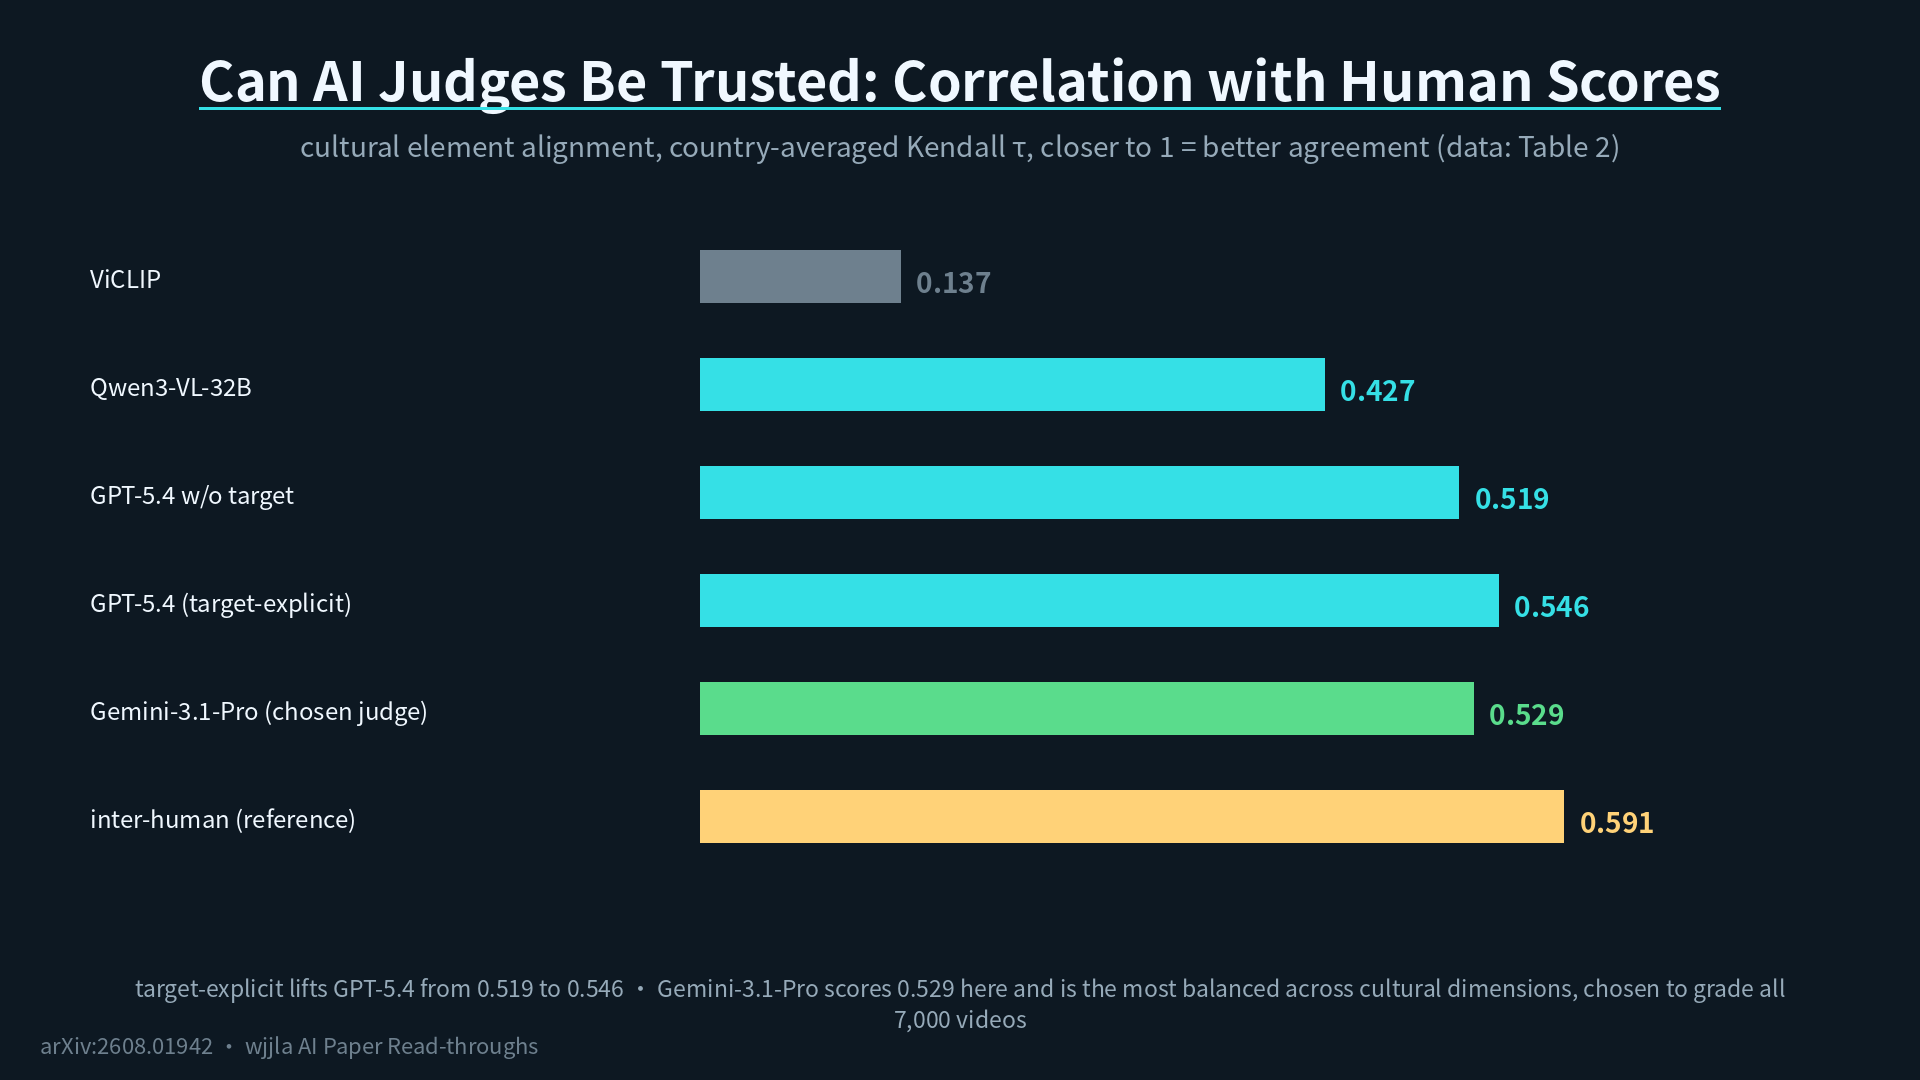
Small models basically cannot do it. ViCLIP, a small image-text similarity model, only gets 0.137. Qwen3-VL-32B climbs to 0.427. GPT-5.4, once the target-explicit protocol is applied, lifts the cultural element alignment score from 0.519 to 0.546, so the protocol itself actually works. The judge the authors ultimately picked is Gemini-3.1-Pro. On this one metric it scores 0.529, slightly below GPT-5.4, but across all cultural dimensions it is the most stable (cultural consistency 0.521, text rendering 0.527), and that is why they used it to score all 7,000 videos.
The key reference line is human-to-human inter-annotator agreement: 0.591. In other words, the best AI judge on cultural dimensions is already approaching the level of agreement humans have with each other. Cultural evaluation has moved from “you must hire people” to “you can let AI have the first pass.” A necessary cold shower: on subjective dimensions like Realism and Visual Quality, humans do not even agree with each other, so AI cannot shine there either. Treat those scores with a shrug.
Between Countries, a 0.3 Chasm
Figure 5 on page 7 spreads the scores by country. That figure (precise numbers live in the appendix) is probably the most practically useful page in the paper for practitioners:
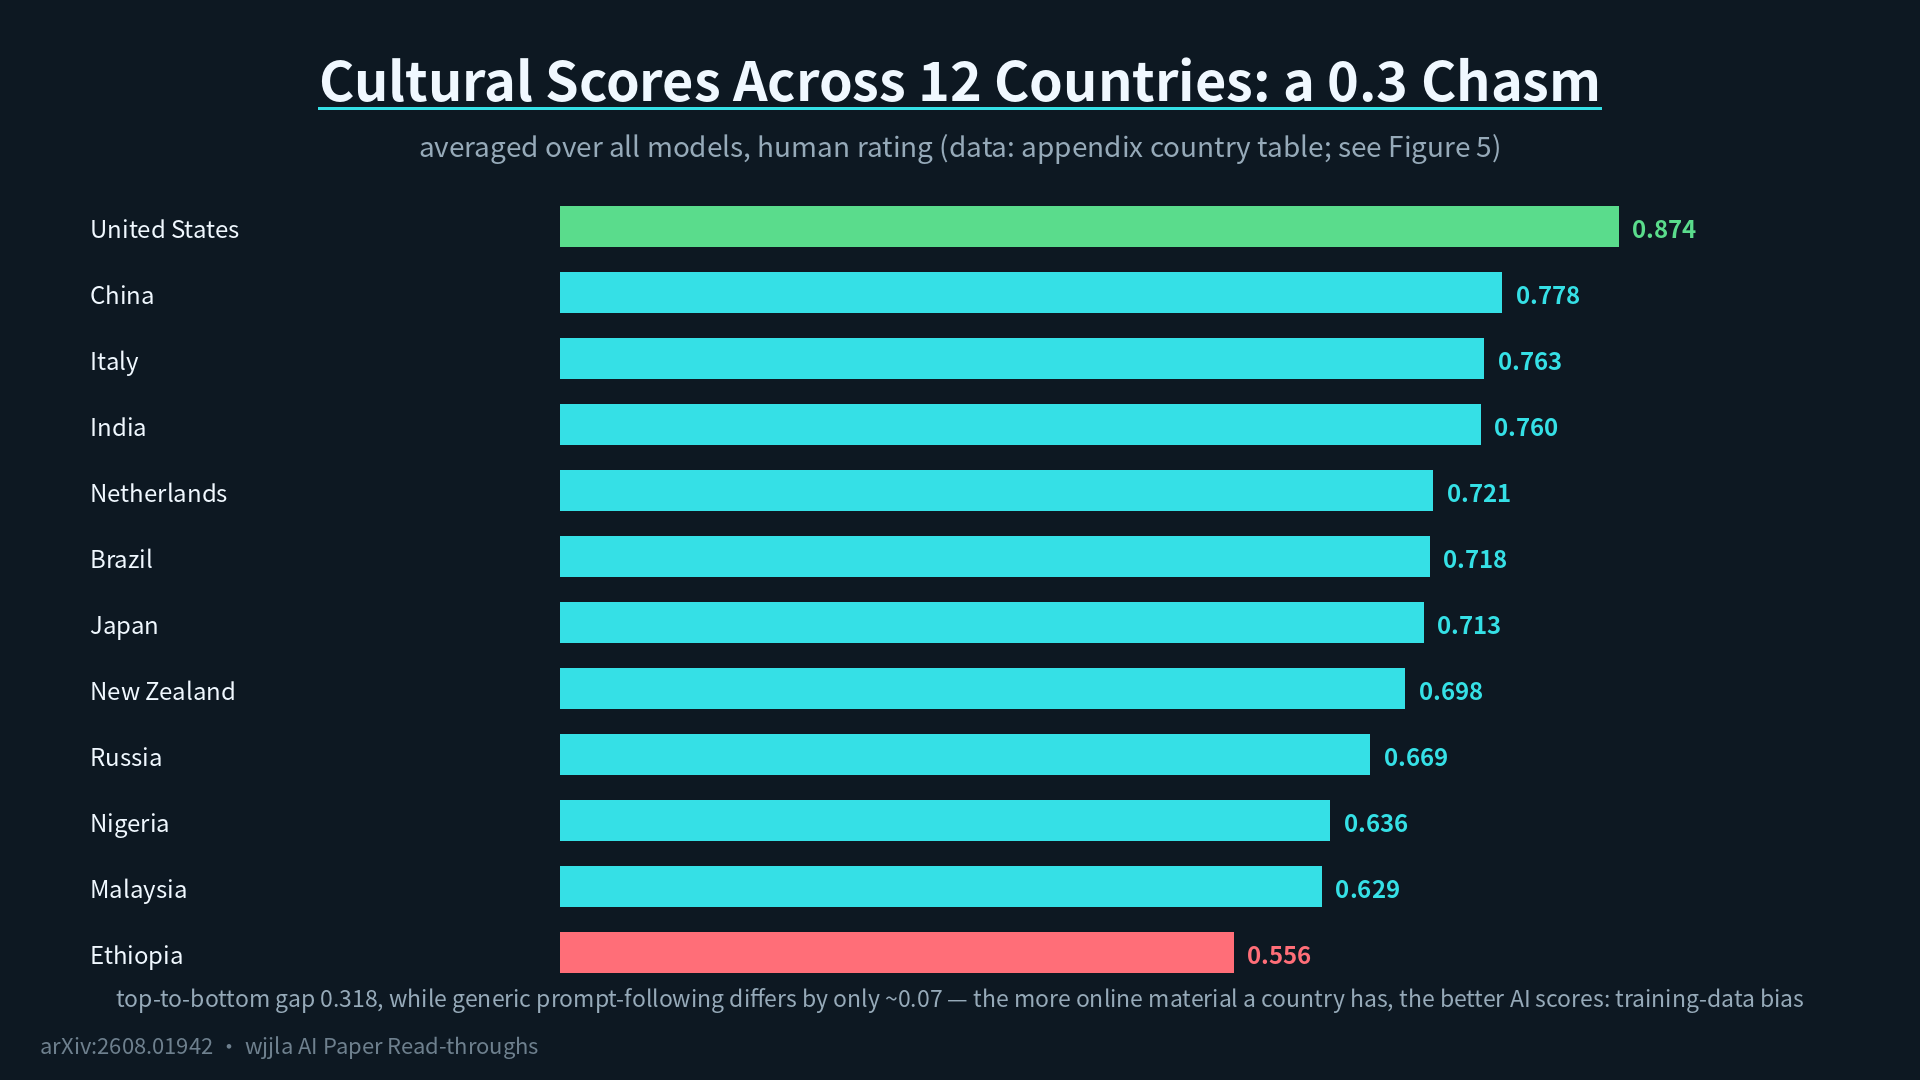
The US at 0.874 is almost off the charts. China at 0.778, Italy 0.763, India 0.760. Below that: Netherlands 0.721, Brazil 0.718, Japan 0.713, New Zealand 0.698. Then Russia 0.669, Nigeria 0.636, Malaysia 0.629. Bottom of the pile, Ethiopia at 0.556.
The gap between top and bottom is more than 0.3. The authors also computed cross-country dispersion per dimension: cultural alignment dimensions hover around 0.3, while prompt-adherence, a general capability, only varies by about 0.07. Translation: every model can shoot “two people playing chess” without losing the thread, but the moment you throw in an Ethiopian shoulder greeting or Japanese shogi, the scores blow apart. The pattern is almost painfully blunt:the more material a country has online, the better AI scores on it. This is not a model-intelligence problem, it is a training-data bias problem.
Figure 6 adds another cut: open-source models drop harder on low-resource countries like Ethiopia, Malaysia, and Nigeria. Closed-source models also drop, but their baseline is high enough that even after the drop they stay in front.
Which Culture Is Hardest to Shoot: Objects Are Easy, Sequences Are Hard
Figure 8 spreads the 14 aspects by cultural category. Material culture scores highest overall, social practice and performance second, ritual and ceremony the hardest. The relative drop from semantic score to cultural score ranges from a mild -15.6% on celebrations to a punishing -30.9% on clothing.
The reason is plain: getting a single object right is a static visual problem. Getting an entire temporal sequence with its ordering and interactions right is a different league of difficulty.
The Figure 7 failure stills are the best footnote. On Japanese shogi, HappyHorse-1.0 nails the scene but the characters on the pieces are all wrong. On the Ethiopian Orthodox cross-gesture, no model can capture the fingertips-pinching-together hand shape. On Malaysian Hari Raya decorations, HunyuanVideo-1.5 just renders them in Christmas style. High-resource culture’s imagery straight up takes over a low-resource culture’s scene.
A Few Things Worth Flagging After Reading
First,do not read total score as capability.The paper’s biggest methodological contribution is splitting “shots well” from “understands right.” A model with 0.8 picture quality and 0.4 cultural score is great for domestic content and a landmine for overseas. Pick the model for the job you have.
Second,the closed-source lead is real, but do not deify it.0.766 means even the closed-source winner still gets close to a quarter of cultural elements wrong. Text rendering at 0.434 proves no model can carry end-to-end accountability. For multi-cultural projects, the localization review step cannot be cut.
Third,the country score table is worth bookmarking.When you make content for a specific market, look up that country’s score first. For high-resource markets like the US, China, and India, mainstream models are mostly trustworthy. For markets like Ethiopia or Malaysia, scores in the 0.55-0.63 range mean nearly half the cultural details are wrong, and humans must cover the gap. Beyond the per-model per-country matrix, the authors do not dig further into causal analysis, whether it is training data volume or data mix that drives the gap. The paper leaves that question open.
Fourth,the AI-judge direction matters more than this specific score.A 1,000-prompt times 7-model evaluation is a scale humans will never finish. The target-explicit protocol (list goals, find evidence, then score) pushes AI-judge correlation close to human inter-rater agreement, and that recipe will almost certainly become the default for the next wave of multimodal evaluation.
One-line summary: on making videos, AI has graduated. On understanding culture, it is still making up coursework, and this paper hangs the first report card on the wall.
Paper: CultureVidBench: Benchmarking Cultural Understanding in Text-to-Video Generation
arXiv: https://arxiv.org/abs/2608.01942
Project page: https://hanxjing.github.io/CultureVidBench/