
In 1998, two independent teams announced that the universe is not just expanding — the expansion is accelerating. That discovery earned the 2011 Nobel Prize in Physics. Nearly three decades later, “the universe is accelerating” has become near-common knowledge.
But common knowledge has a habit of wobbling when someone actually digs into the raw data.
In September 2026, Animesh Sah and Mohamed Rameez from the Tata Institute of Fundamental Research in Mumbai, together with Subir Sarkar at the University of Oxford, published a five-page paper in Monthly Notices of the Royal Astronomical Society: Letters (MNRAS Letters; the preprint went up in June). They had no new telescope data, no fresh sky survey — they simply applied an “age correction” to the existing 1,701 Type Ia supernovae in the Pantheon+ catalogue and found that the monopole component of cosmic expansion flipped from negative to positive.
In plain language: the signal for accelerated expansion disappeared after the correction.
My reading: this is not a “Nobel Prize overturned” paper, but it is a serious wrench inserted into the joints of the evidence chain. Let me walk you through it from the top.
Standard Candles: Using Streetlights to Measure Distance
To understand what this paper does, you first need to know how astronomers measure cosmic expansion.
The core method is called a “standard candle” — an object whose intrinsic brightness is known. Think of a streetlight: if you know the bulb is 60 watts, you can calculate how far away it is by how dim it appears. Type Ia supernovae are among the brightest “streetlights” in the universe: a white dwarf accretes matter from a companion star, reaches a critical mass called the Chandrasekhar limit, and undergoes a thermonuclear explosion with nearly uniform peak brightness. After applying the Phillips-Tripp formula to correct for “stretch” (how long the brightness lasts) and “colour” (redder = dimmer), each supernova becomes a reliable distance indicator.
The largest unified catalogue of Type Ia supernovae is called Pantheon+, released in 2022 with 1,701 objects. The 1998 Nobel discovery — and every “the universe is accelerating” conclusion since — relies on this kind of standard-candle data.
But there is a critical assumption: supernova properties do not evolve with redshift. In plain terms, distant supernovae are “just as bright” as nearby ones. If this assumption breaks, the entire ruler is bent.
What Sah et al. did in this paper is test that assumption.
The Age Correction: Distant Streetlights Were Already Dimmer
In 2020, Kang et al. reported a roughly 3-sigma correlation between standardised Type Ia supernova luminosity and the stellar-population age of the host galaxy: supernovae with younger progenitor stars are fainter. In 2022, Lee et al. clarified that this is not a coincidence — it arises from a more fundamental dependence of the width-luminosity and colour-luminosity relations on progenitor age.
In 2025, Chung et al. used 300 galaxies at redshift z < 0.45 to estimate host galaxy ages, boosting the significance to 5.5 sigma. That same year, Son et al. proposed a correction formula:
Correction Δm(z) = Δage(z) × 0.030 mag/Gyr
where Δage(z) is the change in mean progenitor age of distant supernovae relative to local ones (z = 0), and the slope 0.030 mag/Gyr is the average of Chung et al.’s measurements from two independent samples.
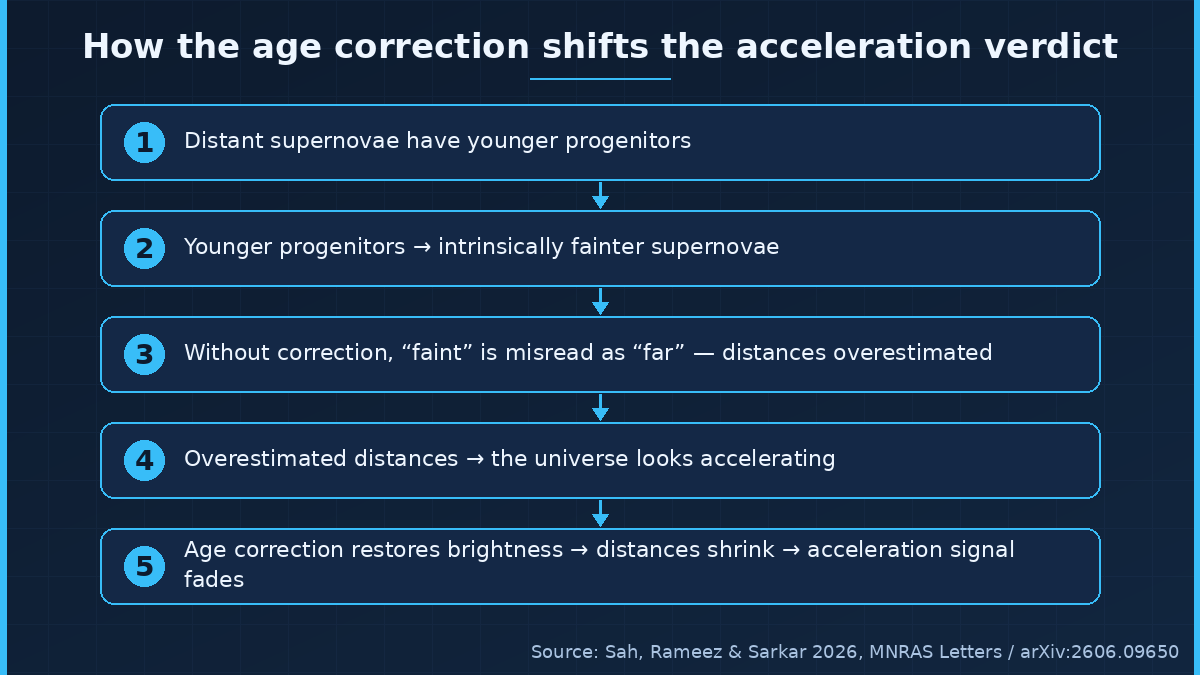
The direction of this correction is critical. Let me trace it step by step:
Step 1: Distant supernovae have younger progenitors (because the cosmic star formation history was different in the early universe).
Step 2: Younger progenitors produce inherently fainter Type Ia supernovae (the physical mechanism established by Lee et al. 2022).
Step 3: Without correction, this “faintness” is entirely misinterpreted by the standard-candle assumption as “far away” — distances are overestimated.
Step 4: Overestimated distances change the shape of the Hubble diagram — making it look like the universe is accelerating.
Step 5: The correction compensates for the “inherently faint” component. After correction, distant supernovae are effectively brighter, distances shrink, and the acceleration signal weakens or vanishes.
Figure 1 in the paper shows this visually: black dots are uncorrected apparent magnitudes, red dots are age-corrected. At redshift z = 0.8, the red dots sit clearly below the black ones — and since the magnitude axis is inverted (lower = brighter), the correction genuinely makes distant supernovae “brighter.”
Cosmography: Drawing the Map Without a Map
Once the brightness is corrected, how do you tell whether the universe is accelerating or decelerating?
Sah et al. use a method called “cosmography” — no assumed cosmological model (no commitment to dark energy or any specific theory), just a third-order Taylor expansion of the luminosity distance in redshift. The expansion coefficients naturally correspond to three physical quantities: the Hubble constant H₀, the deceleration parameter q₀, and the “jerk” j₀.
The name “deceleration parameter” is a bit counterintuitive: positive = decelerating (braking), negative = accelerating (stepping on the gas), zero = constant speed.
To ensure convergence of the Taylor expansion, they imposed a redshift cut of z ≤ 0.8 on the Pantheon+ catalogue, excluding only 31 out of 1,701 supernovae. They then decomposed q₀ into two parts: a monopole qm (the same in all directions, representing “global” behaviour) plus a dipole 𝒒d (direction-dependent, representing “local” anisotropy), with the dipole direction initially fixed to the cosmic microwave background (CMB) dipole direction.
This is a purely data-driven method. It does not depend on a dark energy model. In other words, they are not “testing dark energy” — they are “mapping cosmic expansion.”
The Core Result: Monopole Flips Positive
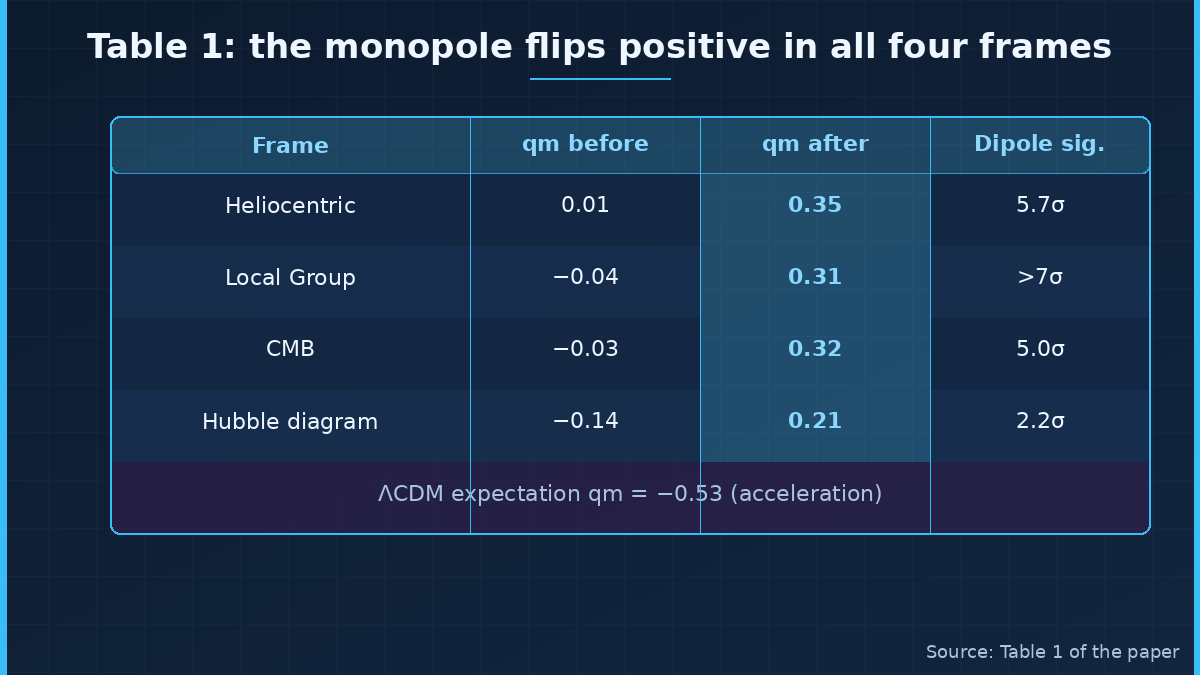
Table 1 in the paper gives complete data across four reference frames. I will highlight the two most compelling:
In the Local Group (LG) frame — treating our neighbourhood including Andromeda as stationary — the monopole qm went from −0.04 before correction to 0.31 after. The dipole 𝒒d shifted from −61.4 to −62.0, with statistical significance above 7 sigma — the change is within uncertainties.
In the heliocentric frame (Sun as stationary), qm went from 0.01 to 0.35.
CMB frame: −0.03 → 0.32.
Hubble diagram frame (CMB + peculiar velocity corrections): −0.14 → 0.21, but this one has the lowest significance at only 2.2 sigma.
Across all four frames, the monopole flipped to positive after correction. Meanwhile, the standard cosmological model (ΛCDM, with dark energy) expects qm = −0.53. The corrected best-fit points moved away from that expectation.
In plain language: the acceleration signal disappeared after the age correction. The universe may currently be decelerating.
The Dipole Remains: Local Anisotropy Did Not Vanish
Here I must clear up a common confusion: the dipole 𝒒d and the monopole qm are two entirely different parameters.
The dipole = strong in one direction, weak in another. Like Earth’s magnetic north and south poles. It describes “local anisotropy” — our patch of the universe expanding differently in different directions.
The monopole = the same in every direction. It describes the “global average” — is the universe as a whole accelerating or decelerating?
The correction changed the monopole, not the dipole. In the LG frame, the dipole barely budged (−61.4 vs −62.0, confirmed at >7σ). Its decay scale corresponds to redshift z ≈ 0.01, roughly 30 h⁻¹ Mpc, consistent with what you would expect from the local bulk flow.
Figure 4 shows the dipole amplitude across 17 radial shells (roughly 100 supernovae each) versus median redshift: significant at low redshift, decaying at high redshift. The corrected points (stars) and uncorrected points (open circles) nearly overlap.
What does this mean? The age correction did not eliminate the finding that “the local universe has directional differences.” It only changed the conclusion about whether the universe as a whole is accelerating or decelerating.
Four Reference Frames: Same Data, Four Faces
The paper repeated the analysis in four reference frames: heliocentric, Local Group, CMB, and Hubble diagram. Why four? Because your choice of reference frame affects what “pattern” of cosmic expansion you see.
One interesting detail: the dipole 𝒒d is negative in the heliocentric and Local Group frames but positive in the CMB and Hubble diagram frames — it flips sign. The reason is that the Sun and the Local Group move in different directions relative to the CMB (heliocentric frame moves at 369.82 km/s relative to CMB; the Local Group at 620 km/s). Switching reference frames naturally reverses the dipole.
The four frames give different monopole values (0.35, 0.31, 0.32, 0.21) but qualitatively agree: all positive. The weakest, the Hubble diagram frame at 2.2 sigma, does the most corrections (CMB + peculiar velocities), losing the most statistical power.
My reading: cross-frame qualitative consistency is good, but the 2.2-sigma number cannot be ignored. In particle physics, 5 sigma is the threshold for a “discovery”; 2.2 sigma is, at best, a “hint.”
The Objections: Not Everyone Agrees
Science is not a solo performance. Serious objections exist — both before and after this paper.
The most direct comes from Wiseman et al. (2026). They criticise Chung et al. and Son et al. for not performing host-galaxy mass standardisation, and argue that once you control for host galaxy mass, the correlation between supernova brightness and progenitor age disappears. They also state that the progenitor age difference between nearby and distant supernovae was overestimated, due to questionable assumptions about the supernova delay-time distribution.
The paper cites this objection in a footnote but responds only with “The debate continues” — no data-level rebuttal. This is my biggest frustration with the paper: you used the very slope value (0.030 mag/Gyr) that Wiseman challenged as your core correction parameter, yet you did not directly address “this slope itself might be wrong.”
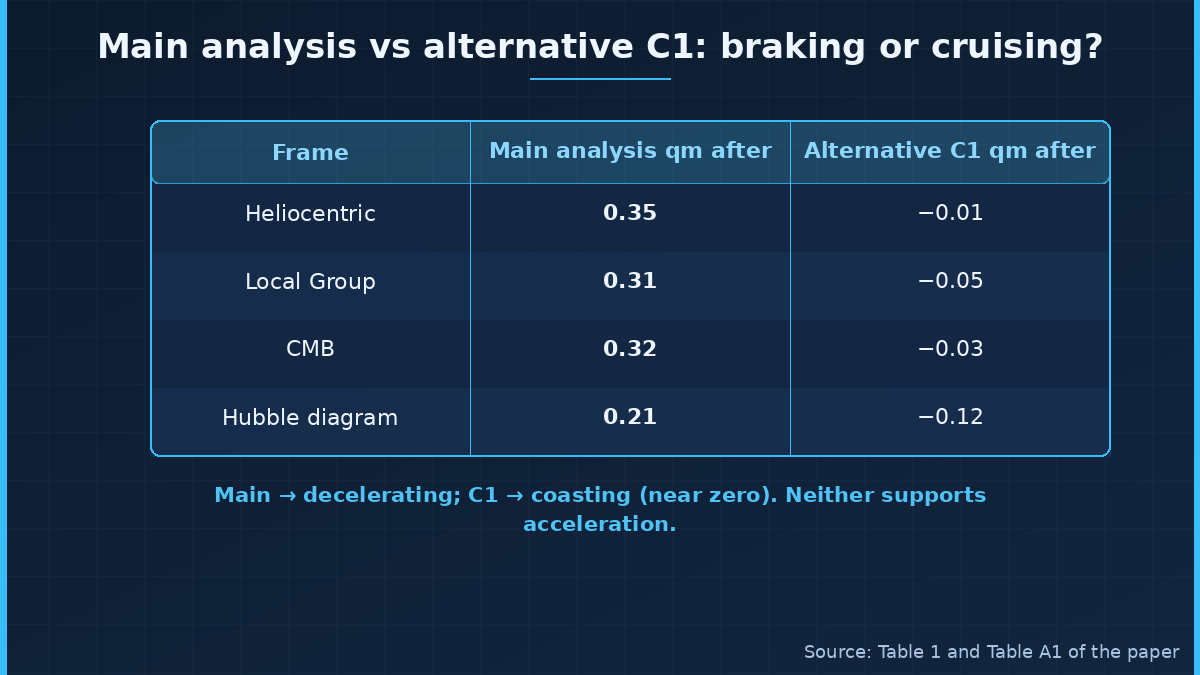
Another important check is the alternative analysis C1 in the paper’s appendix. C1 uses the sample and redshift-dependent stretch/colour corrections recommended by Rubin & Heitlauf (2020) — a more conservative standardisation scheme. C1 results: after correction, qm is close to zero (heliocentric −0.01, LG −0.05, CMB −0.03, HD −0.12). Close to zero means: constant-speed expansion — neither accelerating nor decelerating.
The main analysis says “decelerating”; the alternative says “constant speed.” Neither supports “accelerating,” but “decelerating” and “constant speed” are different conclusions. The paper does not adequately discuss why the two analyses diverge or which is more reliable.
There is also Zhou et al. (2025), who report “no hint of anisotropy” in the Hubble expansion rate. But Sah et al. note that Zhou used Hubble-diagram-frame redshifts (which minimise anisotropy by construction) and integrated over redshift in each direction, diluting the signal that is more prominent at low redshift.
Not Just One Paper: A Seven-Year Chain
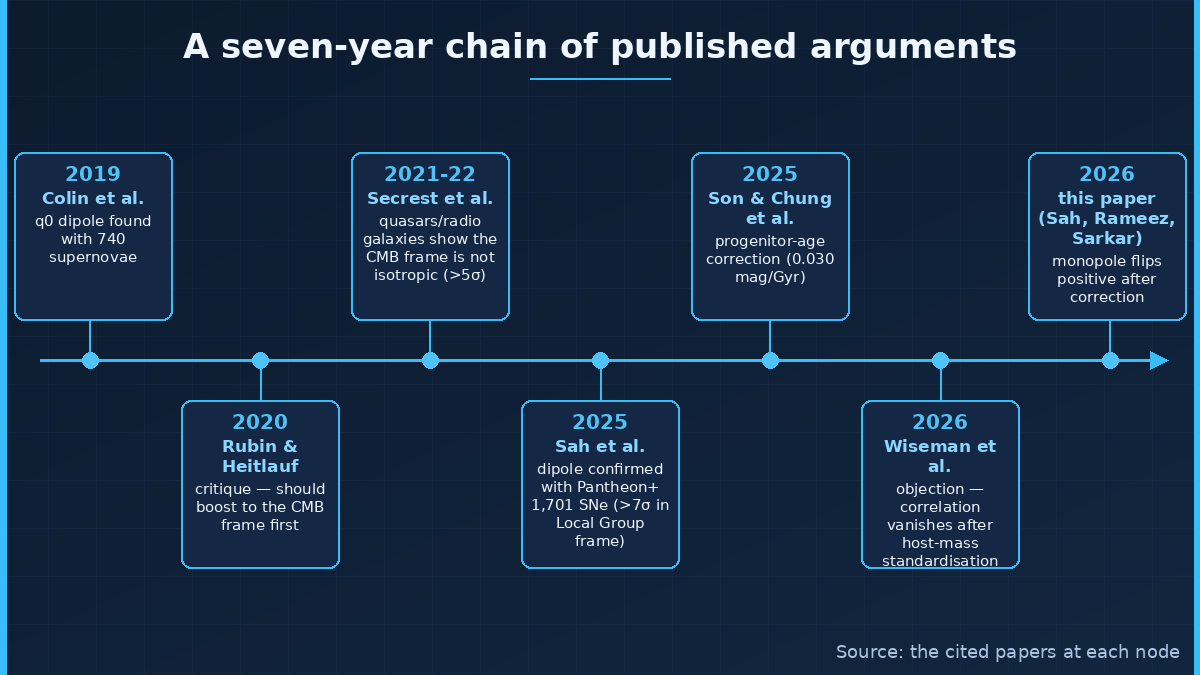
This is not an isolated paper. Place it on a timeline and you see a seven-year-long argument:
2019: Colin et al. analyse 740 JLA supernovae and find that q₀ has a dipole structure aligned roughly with the bulk flow.
2020: Rubin & Heitlauf criticise: you should have boosted to the CMB frame first.
2021-22: Secrest et al. use quasars and radio galaxies to show that the CMB-frame isotropy assumption does not hold — these distant tracers have a dipole misaligned with the CMB dipole at >5 sigma. This directly answers Rubin’s criticism.
2025: Sah et al. use the full Pantheon+ 1,701-supernova catalogue to confirm the q₀ dipole, most significant in the Local Group frame (>7 sigma).
2025: Son & Chung propose the progenitor age correction and report a currently decelerating expansion.
2026: This paper (Sah, Rameez & Sarkar) applies the age correction to Pantheon+ and finds the monopole flips positive too.
Each step has its own supporting paper. Each step responds to the previous step’s criticism. This is not “one paper overturns the Nobel Prize” — it is a gradually tightening chain of evidence.
But I must also say: the chain’s core assumption — that bulk-flow effects can account for the observed acceleration — has not been independently verified. It is a self-consistent argument, not a proven one.
Three Things
First, the evidence for cosmic acceleration is not set in stone. A “small screw” called progenitor age, once tightened, shifted the wall’s lean — the monopole of 1,701 supernovae flipped from negative to positive, moving away from the ΛCDM expectation.
Second, a shifted wall is not a collapsed wall. The Wiseman team argues this screw should never have been tightened — host-mass standardisation eliminates the age correlation. The paper’s own alternative analysis C1 yields “constant-speed expansion,” not “deceleration,” qualitatively different from the main result. The corrected Hubble-diagram-frame monopole is only 2.2 sigma — far below the threshold for a “discovery.”
Third, the 1998 Nobel Prize conclusion has not been overturned, but its foundations are being seriously tested. The Sarkar team’s argument is systematic and incremental, but the objections are equally serious. The right scientific posture is not to rush to declare a winner, but to wait for multiple independent lines of evidence to converge on the same conclusion. Currently, cosmic acceleration remains the picture supported by multiple independent probes (supernovae, baryon acoustic oscillations, CMB anisotropy, gravitational-wave standard sirens) — this paper only pries at the supernova line.
Not overturned. But the foundations are being seriously tested. That is exactly what science is supposed to look like.
Sah, A., Rameez, M., Sarkar, S. (2026). Pantheon+ supernovae corrected for progenitor age indicate the universe is decelerating. MNRAS Letters 000, 1-5. arXiv:2606.09650. CC-BY.