
WCRF CUP Global systematic literature review and meta-analysis, medRxiv preprint (DOI 10.64898/2026.06.22.26355879, posted 2026-07-01, not peer reviewed). 158 papers, 51 cohorts, over 281,000 cancer cases, 19 cancer sites. This is an engineer’s deep read, not a summary translation. I won’t do health advice and I won’t pick your drink for you.
1. Why “Do Drinks Cause Cancer?” Has Been a Mess
Cola, diet cola, orange juice — these are the three most-consumed non-water beverage categories on the planet. Over the past decade, every few months a paper has claimed “this type of drink may raise the risk of that cancer”, and a few months later another has said “no significant association”. The result is a soup in the public mind.
Two things cause that soup.
The first ismessy exposure definitions. Older reviews routinely lumped sugared cola, diet cola, flavoured sparkling water, and energy drinks into “soft drinks”; they pooled pure juice with sugar-added juice drinks into “juice”; they sometimes merged SSB and ASB into a single analysis. As an analogy, it’s like studying “does alcohol hurt the liver?” by putting baijiu, beer, and red wine in the same bucket. You might get a population-level correlation, but anything specific to one drink and one risk is destined to come out blurry.
The second ismixed study designs. At the bottom of the evidence pyramid sit case-control studies (find patients, ask them what they drank in the past) — these are most vulnerable to recall bias. Higher up sit cohort studies (record what healthy people drink, follow them for years, see who gets sick) — a tier more reliable. Older reviews mixed both types, so the weakest tier dragged every conclusion down.
That is why, when an authoritative institution decided to “do it again” — not patch up the old reviews, but pull every qualifying global study together in one clean pass — it deserves a serious look. The team behind the WCRF International CUP Global programme, a coalition including Imperial College London, IARC, WCRF and NCI, published this July a systematic review titled Sugar sweetened and artificially sweetened beverages, fruit and vegetable juices and cancer risk. They did the work from scratch.
So how did they do it? That is the next key question.
2. How CUP Global Ran the Tally
The team’s play splits into three moves: ruthless filtering, hard grading, and separating mechanism from epidemiology.
Ruthless filtering.They pulled 17,309 deduplicated records from PubMed and Embase, ran them through a PRISMA pipeline, and ended up with 158 qualifying publications — all cohort studies, zero case-control. That means working from the upper-middle of the evidence pyramid, undragged by bottom-tier noise. These 158 papers came from 51 independent cohorts, covering 281,560 incident cancer cases across 19 cancer sites — currently the largest exercise of its kind.
Hard grading.Conclusions are not handed down by the authors. Every drink-cancer pair goes before anindependent expert panelthat grades the evidence on a five-tier ladder, strongest to weakest: convincing → probable → limited suggestive → limited no conclusion → substantial effect on risk unlikely. The whole tally has only five combinations that earned the “probable” stamp.
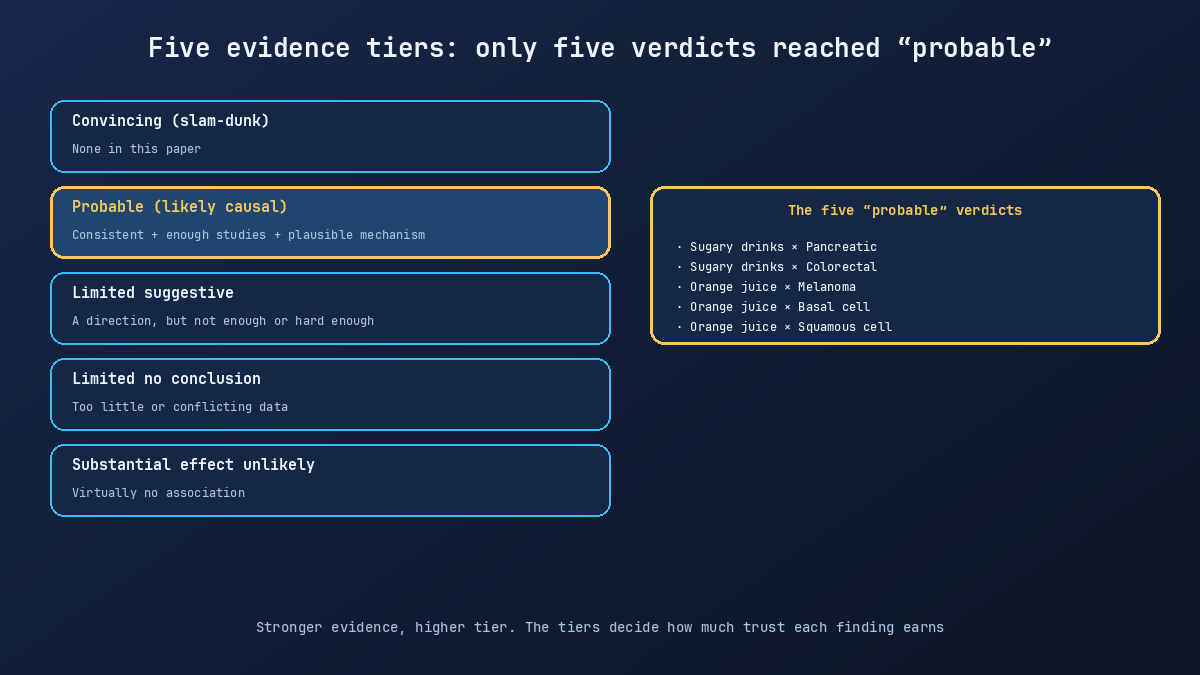
Per Text Box 2, the panel scores each pair on seven dimensions at once: study count, between-study consistency, effect magnitude, dose-response relationship, risk of bias, generalisability, and mechanistic plausibility. The protocol was pre-registered on OSF (protocol id osf.io/7utbm), so the rules weren’t retrofitted to a desired answer.
Separating mechanism from epidemiology.Epidemiology tells you “two variables move together”; mechanism tells you “why they move together”. The authors explicitly placed IARC’s mechanistic review next to the epidemiological findings. When both sides point at the same story, that association is harder than one-sided support. Later we’ll see orange juice and skin cancer is exactly such a “both sides agree” case.
One serving is defined as 355 mL for SSBs (roughly a can of cola) and 177 mL for juices (roughly half a can). All RRs are per “one additional serving per day”.
The filtering and grading are out of the way. So what did the tally actually find?
3. Sugar-Sweetened Drinks: Two “Probable” Cancers, the Rest Only “Suggestive”
The first defendant is the sugar-sweetened beverage (SSB), the one the public knows best.
The tally hands down two tiers of judgement.
Tier 1 — probable (likely causal):Pancreatic cancer RR 1.09, 95% CI 1.01–1.16, I²=8% (18 studies, ~4,914 cases); colorectal cancer RR 1.07, CI 1.00–1.14, I²=41% (13 studies, ~12,649 cases). Between-study heterogeneity is low in both, directions are consistent across studies, and on that basis the expert panel stamped “probable”.
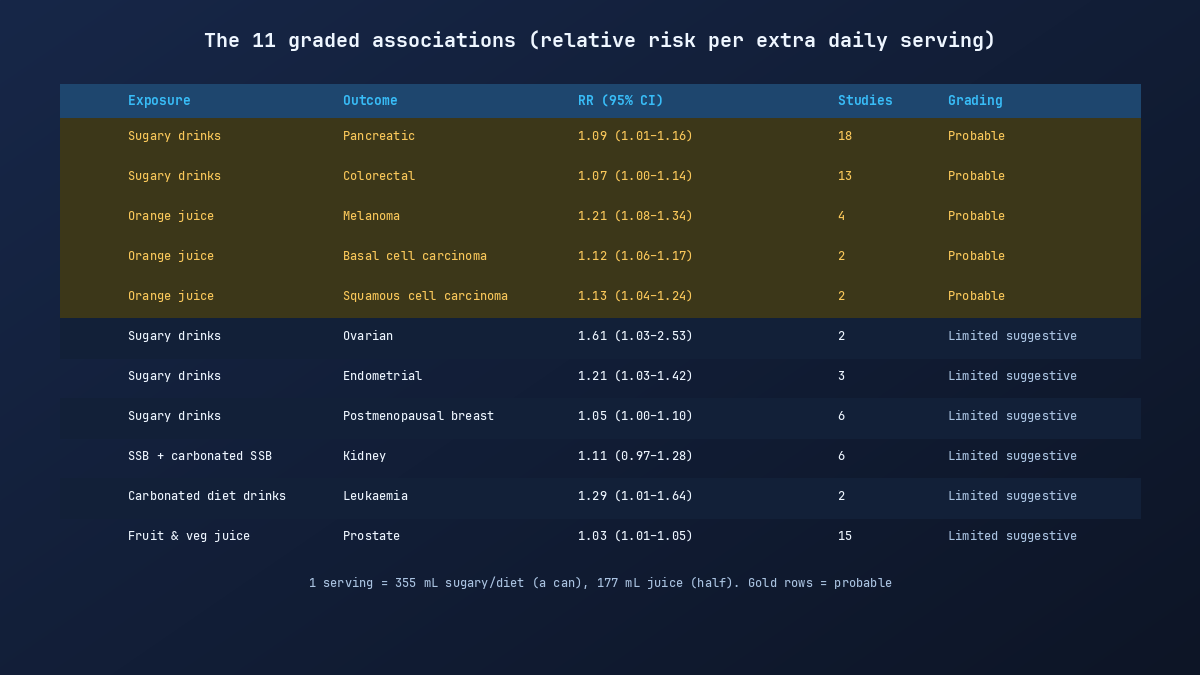
Tier 2 — limited suggestive:Ovarian cancer RR 1.61 (CI 1.03–2.53), endometrial cancer RR 1.21 (CI 1.03–1.42), postmenopausal breast cancer RR 1.05 (CI 1.00–1.10), kidney cancer RR 1.11 (CI 0.97–1.28, CI crosses 1).
The biggest number sits with ovarian cancer — 61%. Why didn’t it upgrade? It rests on only 2 studies and 228 cases; the sample is just too small. The panel explicitly cited “small number of studies and cases” as the core reason it stays at “limited suggestive”. This is actually a useful reminder:when you see a big number, first check how many studies and cases are behind it. A modest number like 1.05 with CI just kissing 1.10 is backed by 6 studies and over 10,000 cases — a much steadier signal.
On the mechanism side, the authors cite IARC’s mechanistic review’s conclusion: there isno strong evidence for an insulin- or glucose-pathway link. This is the classic “stable epidemiology, mechanism unclear” pattern. The authors acknowledge that the mechanistic literature has its own structural flaws (lack of longitudinal designs, inconsistent exposure and phenotype definitions, weak control of key confounders), but they also point out that the chain “added sugar → weight gain → obesity → multiple cancers” has already been well established (the WCRF/AICR Third Expert Report in 2018 made exactly this case). In other words, the authors couldn’t find direct evidence of a “sugar → insulin pathway → cancer” mechanism, but the indirect “sugar → obesity → cancer” chain has long been standing.
One byproduct worth flagging:when SSBs are replaced by ASBs, proximal colon cancer risk drops 16%(RR 0.84, CI 0.77–0.95, 2 studies, 1,275 cases). This is a specified substitution analysis (replace SSBs with another drink, then look at the risk change) — far more informative than the simplistic “drinkers vs non-drinkers” comparison. The SSB story is settled, but there’s a more interesting defendant to interrogate: can the popular belief that “sugar-free means safe” hold up?
4. Diet Cola: Mostly Null Across Cancers, But One Leukaemia Link Is Unsatisfying
The second defendant is the artificially sweetened beverage (ASB) — diet cola, sugar-free sparkling water, and their kin.
The overall judgement is light: across 15 studies and 66 exposure-outcome pairs, most pairs show no association. The single pair earning “limited suggestive” iscarbonated ASBs and leukaemia— RR 1.29, CI 1.01–1.64, I²=0% (2 studies from one merged analysis of large health-professional cohorts, 339 cases).
That number looks modest, but the panel didn’t upgrade it for a reason the authors lay out bluntly in the Discussion:reverse causation cannot be ruled out. Reverse causation is getting cause and effect backwards — it’s not that diet drinks cause leukaemia, it’s that peopleabout to develop metabolic trouble(rising blood sugar, gaining weight) actively switch from sugary to sugar-free. In other words, “drinking diet” may just be a marker of “health going downhill”, not a cause.
One more thread worth pulling: ASBs and pancreatic cancer came in at RR 1.05 (CI 1.00–1.10) — a marginal signal that looks stable at first glance, but**>95% of the analytical weight comes from a single large US cohort**(paper L627–632), and the panel therefore assigned “limited no conclusion” outright. A “stability” propped up by a single study can be entirely eaten by that one study’s bias.
On mechanism, the paper includes an unsettling aside: animal experiments show potential carcinogenicity signals for aspartame; long-term rat cancer-study re-analyses back the signal; but short-term animal studies broadly support safety. The long-term real-world effects at intakes below the established acceptable daily intake, the authors write, “remain uncertain”. I paused at that sentence —it’s a real case of “regulatory approval ≠ health guarantee”. The ADI standard verifies short-term safety below the threshold; whether decades of cumulative intake are harmless in real human bodies is something no one can promise you.
The ASB case as a whole can be described as “basically reassuring, but with a thorn”. Where’s the real heavyweight then? The third defendant is practically synonymous with health in popular imagination — juice.
5. Juice: Orange Juice Probable Across Three Skin Cancers, and the Mechanism Story Tells Itself
The third defendant is juice, and it is the most counter-intuitive part of the whole tally.
The judgement comes in two tiers.
Tier 1 — probable (likely causal):Orange juice and three skin cancers — melanoma RR 1.21 (CI 1.08–1.34, 4 studies, ~2,912 cases), basal cell carcinoma RR 1.12 (CI 1.06–1.17, 2 studies, 20,840 cases), squamous cell carcinoma RR 1.13 (CI 1.04–1.24, 2 studies, 3,544 cases).
Tier 2 — limited suggestive:Fruit-and-vegetable juice and prostate cancer RR 1.03 (CI 1.01–1.05, pooled across 15 cohorts, 52,680 cases, advanced localised type 1.11 with CI 1.02–1.21).
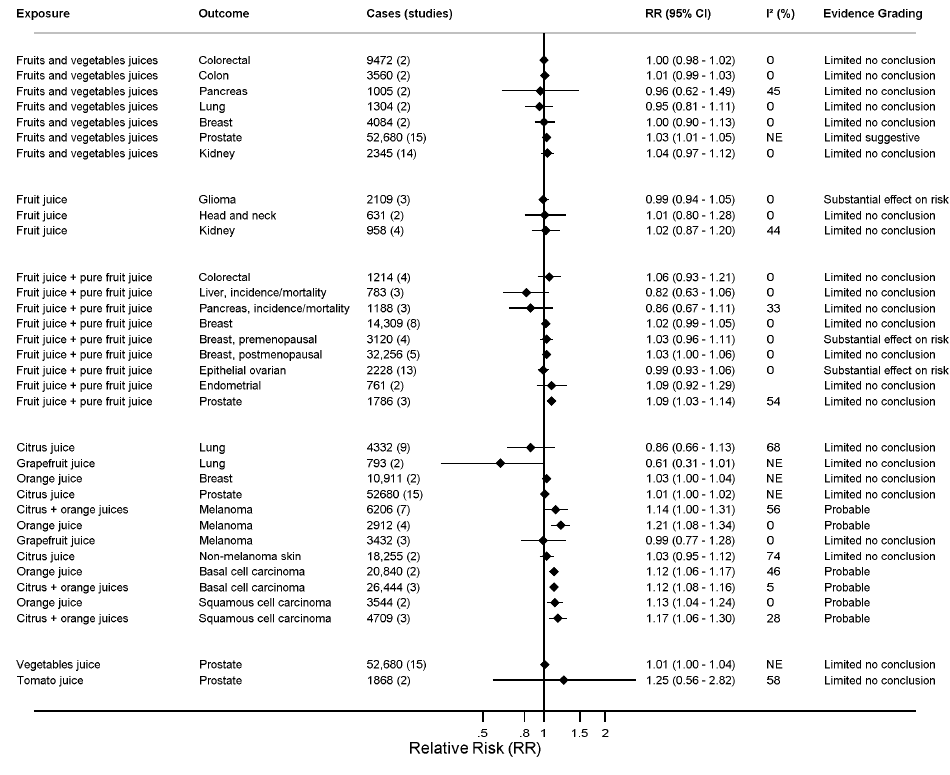
Two details deserve attention. First, the melanoma signal comes withnear-zero between-study disagreement(I²=0%) across 4 studies, in a non-trivial sample — this is not a small-sample fluctuation. Second, while basal cell carcinoma (20,840 cases) and squamous cell carcinoma (3,544) sit at very different sample sizes, both point the same direction as melanoma with CIs well clear of 1, and “multiple cancer sites pointing the same way” is critical support for a “probable” rating.
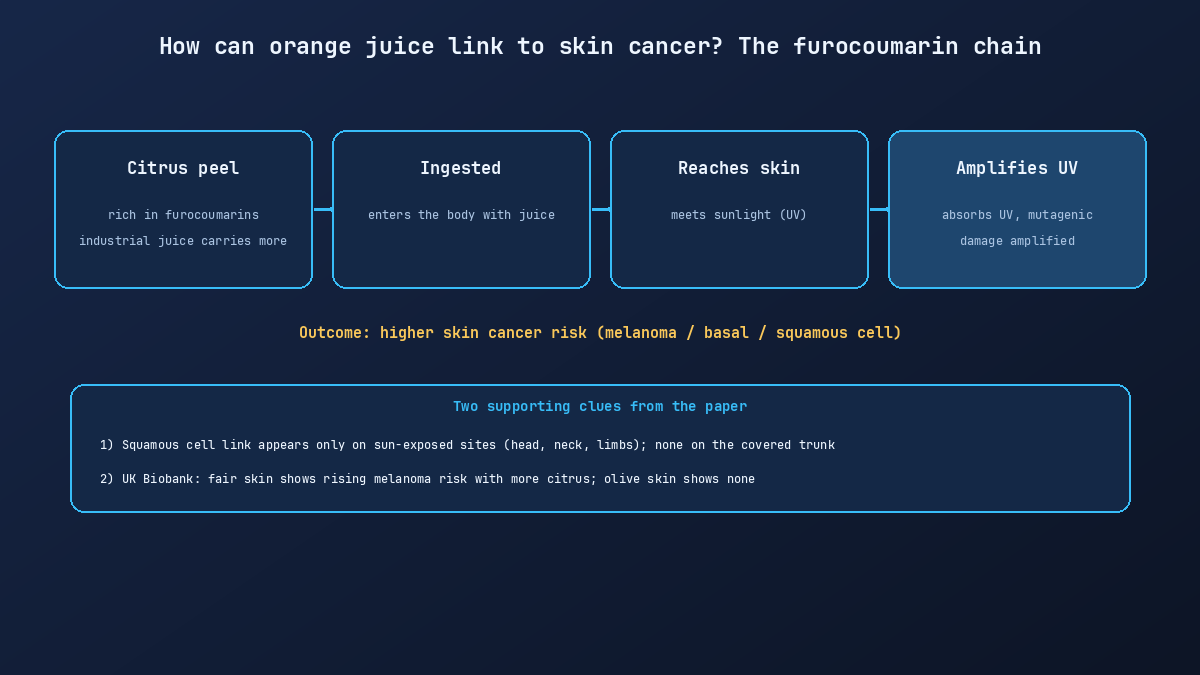
The orange-juice mechanism story is possibly the prettiest passage in the entire paper.The authors explicitly identify the key suspect:furocoumarins (psoralens)— a family of natural photosensitisers in citrus. They absorb UV radiation, trigger phototoxic skin reactions, and produce lethal, mutagenic, and clastogenic effects. Note that “lethal, mutagenic, and clastogenic” is verbatim from the paper — adjectives I did not add.
The two most compelling lines of corroboration:
First,the squamous-cell-carcinoma signal shows up only at chronically sun-exposed sites— head, neck, extremities. The sun-shielded trunk shows no association (data from a pooled analysis of two US health-professional cohorts). If this were just the chemical toxicity of furocoumarins, the trunk shouldn’t be exempt — the only thing that exempts the trunk is the two-factor mechanism: photosensitiser plus UV.
Second,the UK Biobank stratification by skin tone: among fair-skinned people, more citrus intake tracks higher melanoma risk; among olive-skinned people, the association disappears or even mildly reverses. That’s another precise footprint of “the photosensitising mechanism must be paired with UV exposure and fair skin to trigger disease”.
One more mechanistic detail worth mentioning:furocoumarins concentrate in the citrus peel(paper Text Box 1). Industrially processed juice may press the peel in; homemade juice, with the peel removed, brings less of it along. The authors do not give a side-by-side concentration comparison — that is a data pointthe authors do not provide— but the direction is clear.
Grapefruit juice actually contains higher furocoumarin concentrations than orange juice, yet grapefruit juice showsno association with skin cancer— the authors explain this as “low consumption and a high proportion of non-consumers”, so statistical power is insufficient. The explanation is reasonable but not rock-solid evidence.
The prostate cancer 3% is a different story.Fifteen cohorts, 52,680 cases — a tiny number on a huge sample, which would normally upgrade the rating. But the panel kept it at “limited suggestive” because they suspect a more pedestrian explanation —detection bias. People who drink fruit-and-vegetable juice tend to be more health-conscious; they get PSA screening and physicals more often; prostate cancer gets caught more often.It isn’t the juice giving them the disease — it’s the juice drinkers being more likely to have the disease found.The panel kept this at limited suggestive rather than a lower tier because it remains “suggestive”, but the mechanism story has too much human behaviour muddying the water.
With three defendants tried, the authors themselves acknowledge the tally has several obvious holes.
6. The Three Holes the Authors Themselves Acknowledge
In the Limitations section (paper L1007–1042), the authors flag three holes I find most worth pulling out after reading the whole thing.
Hole 1 — single baseline assessment.74% of the studies asked “what do you usually drink?” just once, at enrolment, then followed people for decades. Over decades people switch drinks, switch brands, change habits — none of those changes get captured. The authors acknowledge this is likely toattenuatetrue associations. The direction of bias means: what we see today is alower boundof the real association.
Hole 2 — 82% of studies adjusted for BMI.SSBs are precisely suspected of raising cancer risk via the weight-gain pathway. Strip out the BMI mediator first, then calculate, and you’ve cut one link out of the suspect chain. This willdeflate estimates— which is why the authors repeatedly stress “modestly weaker associations in BMI-adjusted models” in the Discussion. In other words,the real carcinogenic signal of sugary drinks is probably larger than what the paper reports.
Hole 3 — pure juice data is scarce and not separated.Most studies pool pure juice with sugar-added juice drinks. Nutrient composition (especially added sugar) differs completely between the two; pooling them averages away the signal for everyone. This is why “what does pure juice actually do?” remains unresolved.
One moregeographical-heterogeneity detail: in the European subgroup, SSB–colorectal cancer association is RR 1.82 (CI 1.04–3.16), and SSB–breast cancer association is RR 2.07 (CI 1.27–3.38) — both substantially larger than the overall numbers. In North American and East/Southeast Asian subgroups, the signal is much weaker or absent (P for heterogeneity = 0.018 and 0.021). The authors do not give a unified explanation for this gap, but European cohorts differ from North American ones in baseline SSB intake, follow-up length, and population structure. This is another spot wherethe authors do not provide a unified explanation.
Finally, do not forget:this is a preprint that has not been peer reviewed(medRxiv posted 2026-07-01). All numbers, conclusions, and mechanism stories will not be finalised until journal peer review completes. I’m laying out these holes not to dismiss the tally, but quite the opposite — a paper that lays its own weaknesses this bare in the Limitations section is exactly one where you know the authors know what they’re doing.
7. What It Means for an Ordinary Reader — and One Thing I Don’t Do
This article will not end with “you should drink this, and you should drink that much”. That boundary belongs to the task and to the paper authors themselves (the Discussion uses phrases like “supporting public health policies”, “reformulation strategies”, “front-of-pack labelling” — never “the reader should…”). My boundary is the same: I will only lay out what the paper says, what it does not say clearly, and how strong the evidence is. What you drink is your call.
There are a few things one really can read from the evidence:
- The two folk beliefs — “sugar is always worse than sugar-free” and “sugar-free is always safe” — both fail. Evidence is a gradient, not a binary.
- The intuition that “juice is a healthy substitute” needs case-by-case discussion — the orange-juice + sun-exposure line is worth taking seriously, while the 3% prostate-cancer signal is most likely detection bias.
- A small number like RR 1.07–1.13,in plain language, is the per-serving-per-day risk increase— the absolute risk depends on how often you’d encounter that disease to begin with (pancreatic cancer is rare to start with, so the absolute bump per person is tiny).
- This tally isthe best current estimate, not the final answer. Evidence tops out at the “probable” tier, andprobable is not convincing; any popular-science piece that confuses the two is failing its job.
8. The One-Line Takeaway
In this 158-paper tally, sugary drinks are “probable” causes of pancreatic and colorectal cancers; orange juice is a “probable” cause of three skin cancers — the latter driven by the photosensitising chemistry of citrus furocoumarins meeting UV light, not by the juice itself; the real carcinogenic number for sugary drinks is probably larger than the paper reports (82% of studies pre-stripped the BMI mediator); the 3% fruit-juice-and-prostate-cancer signal is most likely detection bias in disguise; and the folk belief that “sugar-free means safe” doesn’t hold up either.
Paper DOI: 10.64898/2026.06.22.26355879 (search the DOI on medRxiv for the full text). Interactive platform: https://teacup.cc.ic.ac.uk/soft-drinks-cancer.html.
(This article is based on the paper’s Summary + Introduction + Methods + Results §SSB/ASB/Juice + Discussion + Limitations + Text Box 1/2 + Research in Context. All RRs, 95% CIs, I² values, study counts, and case counts come from the original.)