
Paper: Gui, Respi, Abbiati et al., “Longitudinal effect of early social media use on standardized learning outcomes during school career,” Nature Human Behaviour, 2026-08-03, DOI10.1038/s41562-026-02522-4, CC BY 4.0. This write-up walks through the academic-trail for 5,227 northern-Italian high-school students, end to end, answering one question: how much does opening that first account early actually cost? Every number comes from the original paper; wherever the authors did not give data, this article says so plainly.
1. The question that lands at your dinner table earlier than you think
It arrives sooner than most parents expect.
Italy’s legal age for digital consent is fourteen. In theory, no one under fourteen should hold a personal social media account without a parent’s nod. The paper puts a number on the gap between theory and practice:
Among 5,227 tenth- and eleventh-grade students,only 16.3 percent actually waited until ninth grade or laterto open a personal account. The rest jumped in earlier: 11.2 percent during primary school, 29.5 percent in sixth grade, 25.0 percent in seventh, and 18.0 percent in eighth.
Source: paper §Results — descriptive analysis, p2.
The legal line functions more as a floor than a ceiling. It does not work as “wait until fourteen to be legal”; it works as a backstop when a parent needs a single sentence to anchor their decision against an eleven- or twelve-year-old asking “everyone else has one.”
And the decision rarely feels abstract. The dinner table is a concrete place. The kid across from you is a concrete person. The deadline arrives well before the legal one.
So the parent stands between two competing pieces of public wisdom. One says “early accounts drag grades down.” The other says “you are being paranoid.” Which one does the evidence actually support?
The honest answer takes some unpacking, because the strength of the prior literature on phones, social media, and adolescent outcomes is much weaker than the headlines suggest.
2. How do you turn correlation into quasi-causation
For about a decade, the studies on phone use and adolescent mood, sleep, or grades have produced effects that are tiny, inconsistent across studies, and tightly tied to the methodology used. Two paths dominated.
Path one is a one-shot survey: gather a bunch of teenagers, ask “about how many hours a day do you use your phone,” ask how they feel, run a correlation. A snapshot taken at one moment in time cannot tell you which side came first.
Path two is the same idea with retrospective recall: “about how many hours a day, in the past week.” Try remembering last Wednesday’s screen time. The noise drowns out the signal.
Both paths dead-end the directionality question. They leave the public conversation stuck in exactly the trap that produced the panic-versus-backlash split.
The paper tries a different route.
Sample: 5,227 tenth- and eleventh-grade students from Lombardy, in northern Italy, from the 2007 and 2008 birth cohorts. These students were tested four times by INVALSI — the Italian National Institute for the Evaluation of the Education and Training System — at the end of second grade, fifth grade, eighth grade (end of middle school), and tenth grade (first year of high school). Longitudinal, standardized, comparable.
The authors then merged this performance record with a custom retrospective survey. Each student reported the grade in which they first opened a personal social media account and first received a personal smartphone. Retrospective, yes — but the authors argue that life-milestone events (“when did you first get a personal phone”) carry reliable memory, even if day-to-day screen-time recall does not.
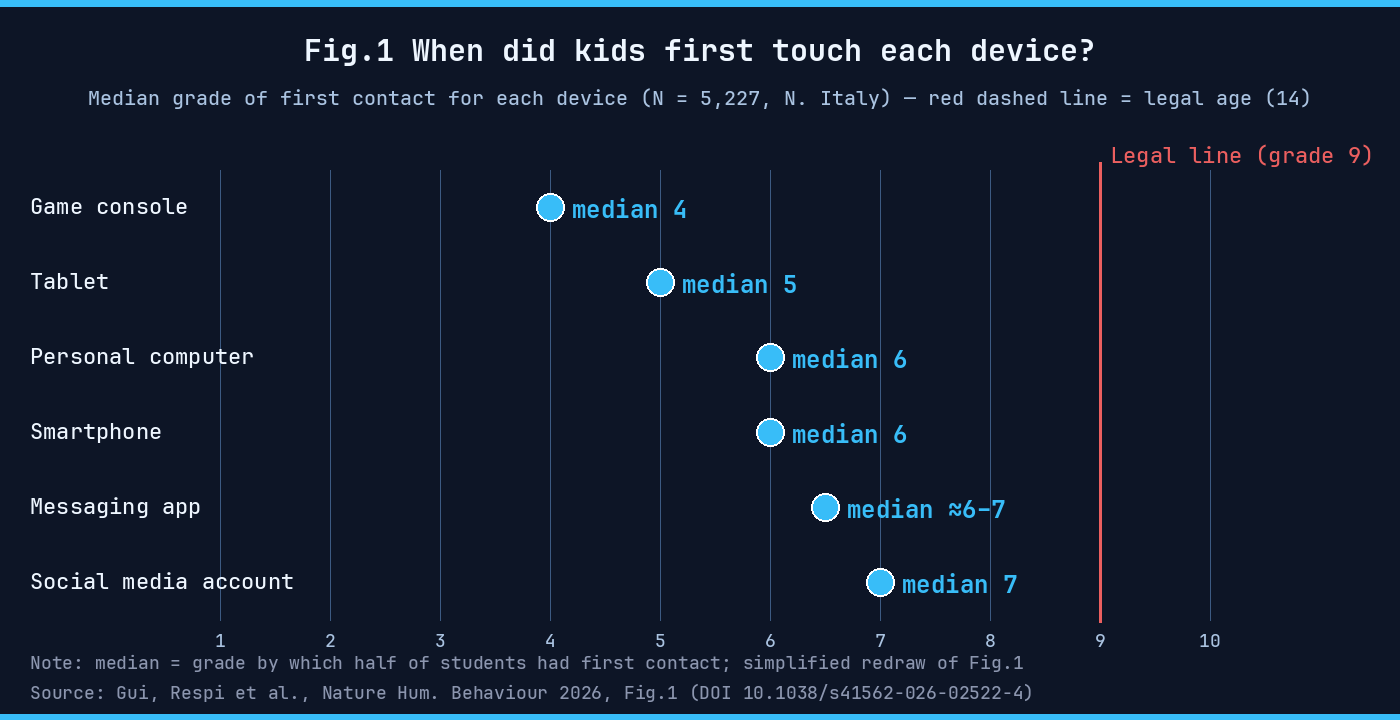
With those two datasets merged, the authors could do something prior work could not. For each “early opener” — a student who opened an account in sixth, seventh, or eighth grade — they built a matched comparison group of “late openers” — students who waited until ninth grade or later. The matching was on observable background: sex, parental education, household structure, nursery attendance, perceived economic hardship, parental-control practices, primary-school technology exposure, and — crucially — the student’s own fifth-grade test scores, measured before any of them had an account.
Then they ran a difference-in-differences (DiD) estimator with student fixed effects on the four longitudinal test scores. The estimate asks: among children who looked comparable before opening an account, how did their grade trajectories diverge after?
The combination — statistical matching plus DiD plus student fixed effects — is not a randomized trial. The authors say so themselves. But it is the strongest observational design available when you cannot randomize when a child opens an account. That distinction will matter again when we get to the limits.
For now, the design tells us this study is leaning hard on two things: (1) a real, comparable, four-time-point test score for every student, and (2) a memory of “first account opened in grade X” that does not have the same reliability problems as “I used my phone 3.4 hours yesterday.”
The next question is what the design actually found.
3. What came out: the earlier you start, the more you lose — and the gap keeps widening
Headline numbers, with the comparison group as ninth-grade-or-later openers.
- Sixth-grade openers: −0.27 standard deviations in math by tenth grade; −0.22 standard deviations in Italian (their native-language test) by eighth grade.
- Seventh-grade openers: −0.22 in math by tenth grade; −0.17 in Italian by tenth grade.
- Eighth-grade openers: −0.11 in math by tenth grade; −0.11 in Italian by tenth grade.The evidence for this group is weaker— see §5.
Source: paper Table 2, row 1 (DiD estimates), p6.
For readers unfamiliar with standard deviations: in education research, differences greater than 0.2 s.d. are considered large. Some agencies use a rough conversion of 0.4 s.d. ≈ one school year of learning. The authors caution that this is a common convenience conversion, not an official equation. Treat it as a tool, not a verdict.
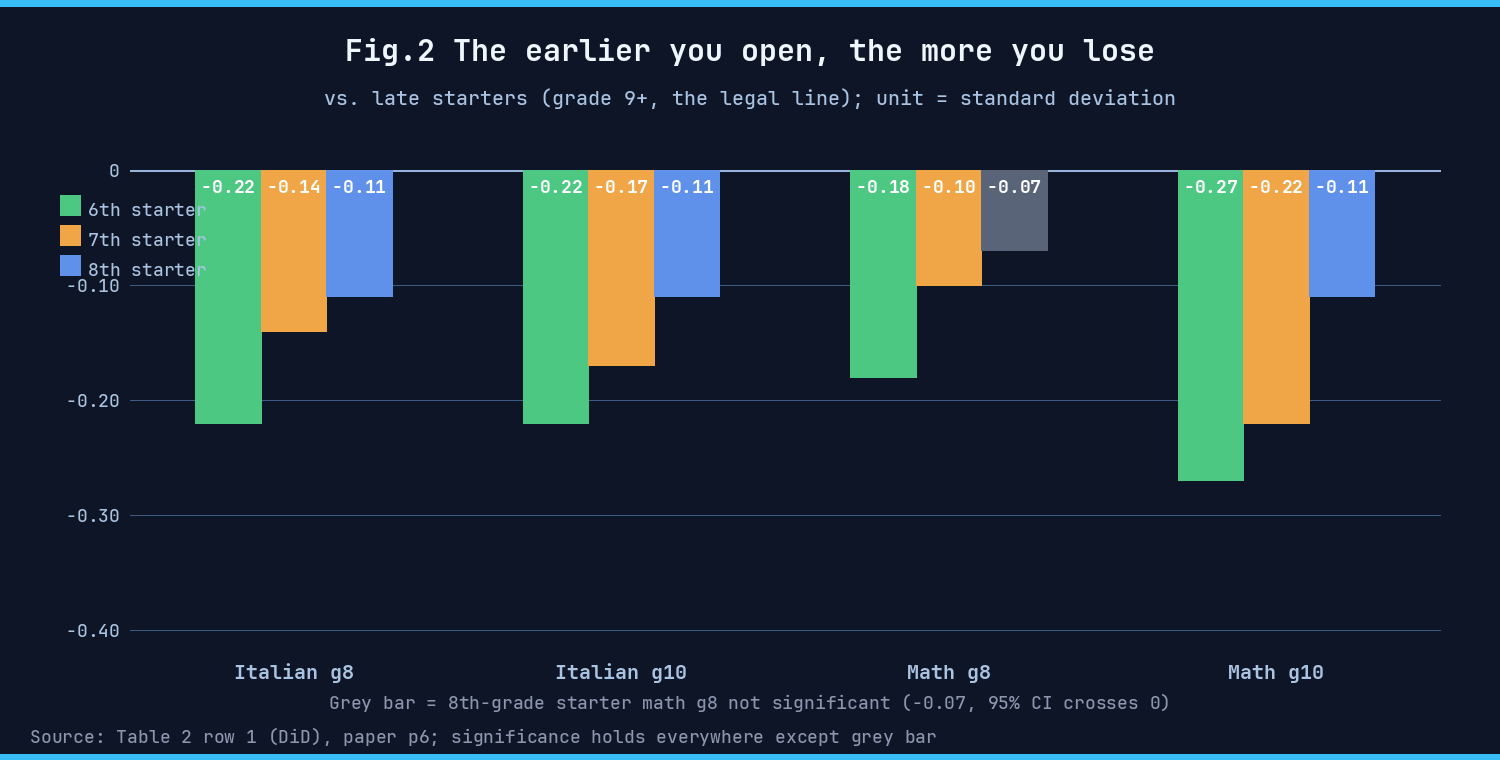
Using that conversion, the math loss for sixth-grade openers lands at roughly half a school year by tenth grade.
The cleanest feature is the dose-response: six, seven, eight — the three “early opener” grades — produce losses that decline monotonically across all four test points (eighth-grade Italian, tenth-grade Italian, eighth-grade math, tenth-grade math). Earlier is worse, and the pattern is not noise.
One subject breaks the pattern.English listening and reading scores run almost flat across all four lines.Early and late openers look effectively the same. The authors offer a hypothesis: a lot of social media content is in English, so scrolling acts as informal listening and reading practice. They explicitly call this a hypothesis with no hard data behind it. Still, the finding is worth flagging: social media does not treat every subject the same way.
Put English aside for now and return to the dose-response.
The thing that makes it uncomfortable is that the gap doesnotclose. By eighth grade, the differences are already visible. By tenth grade, they are larger. In other words, the cost is not a one-time hit. It is a long-term debt: the earlier you start, the higher the interest, and the compounding has not finished by the time these students finish the data window.
To put 0.27 s.d. on a more concrete scale: across Italy, students with two college-educated parents versus those whose parents never finished high school sit about 0.73 s.d. apart — the largest social gap in the data. Sixth-grade early opening recovers roughly30 percent of that largest social divide, in math alone. It also lands at about half the effect of intensive paid tutoring, which sits among the most effective interventions known.
If fig.2 is the dose-response — “how much earlier, how much more lost” — the next question is “what carries the damage.”
4. What carries the damage: not how long, but at which moments
This is the most useful finding to take from the paper.
The authors built a “smartphone pervasiveness index” that scores three specific moments: phone use before sleep, on waking, and during homework. Then they tested whether this index could explain the gap between early and late openers.
The answer was 33 percent to 47 percent of the math loss, depending on the cohort. For Italian, 15 to 34 percent. Roughly a third to a half of the math damage walks through these three moments of phone exposure.
Then the authors tested two things parents usually try.
Parental control software(screen-time locks, app restrictions): the index explains 0 to 5 percent of the gap. Essentially nothing.
Parents viewing their children’s online activity: 2 to 14 percent. Effectively nothing on its own.
Source: paper Table 2, rows 4–6 (mediation analysis), p6.
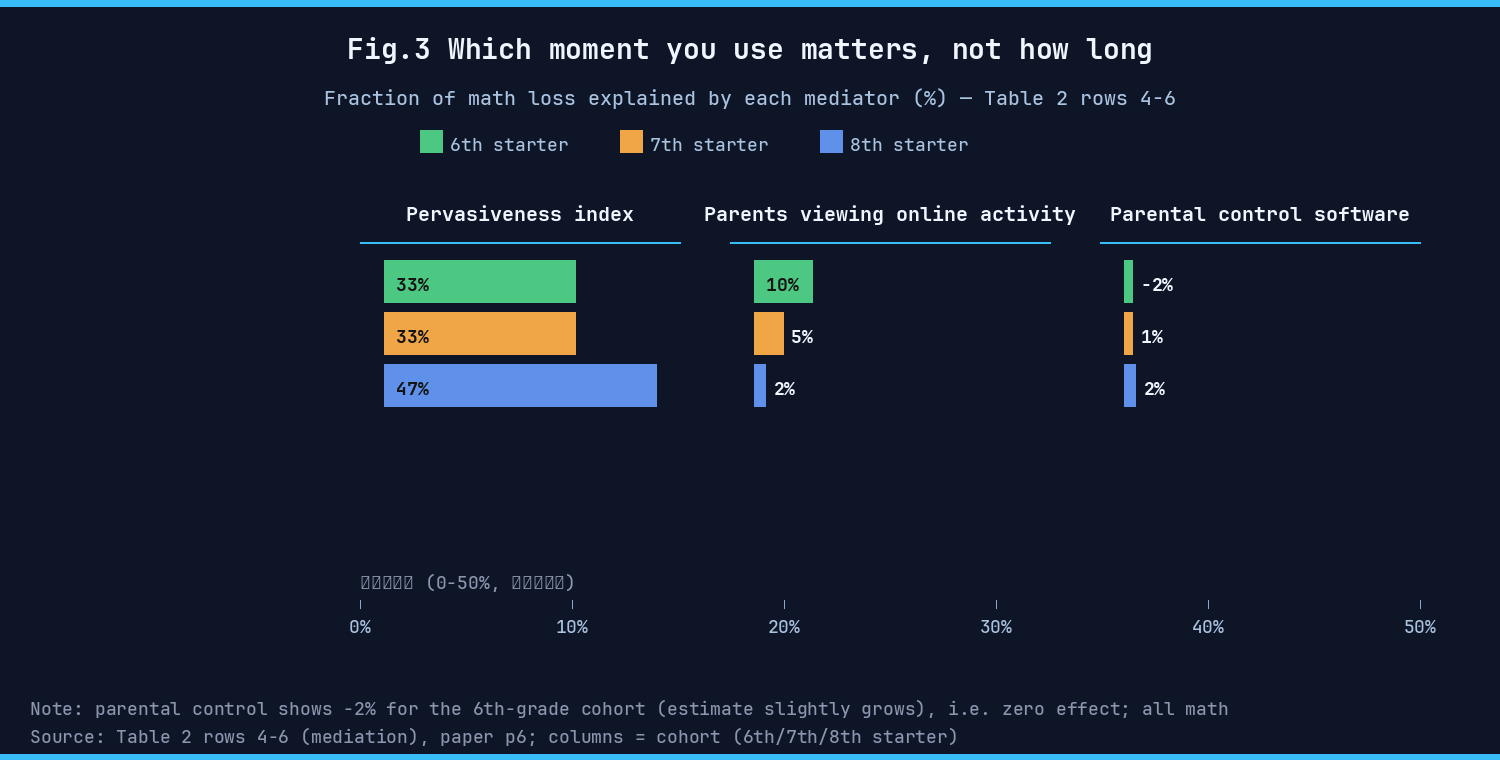
The implication is direct. The damage runs through which moments the phone shows up in, not how long it is used in total. The two interventions parents reach for first — time locks and parental monitoring — target the wrong variable.
The authors also tested subjective well-being (life satisfaction) as a potential mediator. It did not correlate significantly with test scores, so it was set aside.
Translated into something a parent can act on tonight:
- Before sleep: do not keep the phone within arm’s reach.
- On waking: the first action of the morning is not to reach for the phone.
- During homework: the phone is not in the visual field.
Three moments. Not a screen-time lock.
The authors do not write this up as a policy recommendation. That translation is mine, based on the data in Table 2. And before you change anything based on it, §5 is what I owe you next: how much trust this research deserves.
5. Limits, the conflict of interest, and what “quasi-causal” really means
Following the thread I left hanging in §2.
First, this is quasi-causal evidence, not a randomized trial. It holds up only if early and late openers had comparable trajectories before opening the account. The authors ran a Rambachan-Roth honest DiD sensitivity test.The sixth-grade group is the most robust: its tenth-grade math effect stays significant even when pre-treatment drift is allowed to double.The seventh-grade group’s tenth-grade effects are also fairly robust— the paper summarizes the conclusions as holding for early adoption “up to seventh grade”.The eighth-grade group does not pass— its evidence is weaker.
That is why I labeled the eighth-grade column in fig.2 differently from the other two. The point estimate is not necessarily wrong; it is just not robust. Discount it by a tick.
Second, the sample excludes dropouts, short vocational-track students, and students who repeated multiple years. The 2007 cohort — which includes some repeating students — is checked separately in a robustness test, and the estimate is slightly larger there. The paper’s numbers are therefore a lower bound on the population effect. Real-world impact may be worse.
Third,the context is northern Italy in 2019–2023. The social media environment of that period — TikTok- and Instagram-dominant, short-form video on the rise, accessed almost entirely through personal smartphones — has its own shape. Generalizing to other countries or to today is the author’s own caveat, not mine.
Fourth,the English null result has only a hypothesis behind it. “Social media content is in English, so scrolling acts as informal practice” is a reasonable conjecture. The paper does not back it up. Do not turn “no effect on English” into “scrolling helps you learn English.”
Most important: the conflict of interest statement is already on the paper, and I want it on this write-up too.
Two of the co-authors sit on the board of “Patti Digitali,” an Italian foundation that advocates for parents delaying children’s exposure to digital devices.The authors disclosed this in the paper’s Competing Interests section.
So when you read a paper whose authors actively campaign for one side of the policy, that is a bias source worth keeping in mind. But the methodology does not bend because of it. Test scores come from a national standardized system. The account-opening age is a recalled life-milestone, not a contested measurement. The matched comparison was run under three matching methods (entropy balancing, radius matching, nearest-neighbor), all pointing the same direction.
“Position” and “methodology” are separate things, even when one person holds both.
Last note: the “half a school year” conversion is a common heuristic. The authors do not endorse an official equivalence. Any time you see “0.27 s.d. ≈ half a school year” in the wild, it is wearing that exact caveat.
6. Three things to carry home
Back to the long-term-debt metaphor.
How much does opening an account early cost?Children who opened in sixth or seventh grade lose roughly half a school year in math by tenth grade (under one common conversion). Those who waited until fourteen barely slip. And the gap keeps widening through high school.
**Why does which moment beat how many hours?**Because the damage travels through exposure at three specific moments — before sleep, on waking, during homework — not through total screen time. Screen-time locks barely register. Activity monitoring barely registers.
One more thing easy to forget:the authors’ position is on the record. The methodology is independent of it. Read the two separately.
Compressed to a single action sentence: if you can wait, wait — each extra year before the first account shows up in the data. When you cannot or will not wait, the lever that is actually pulling weight is moment-of-use, not total-hours.
The real lesson buried in those 0.27 / 0.22 / 0.11 numbers — and in the fact that “the legal line works as a floor” — is that the simplified sound-bite narratives (“three hours of daily scrolling will destroy your kid”) rarely capture where the real cost accumulates. This paper did not promise a definitive answer; it offered a careful one. That is the version worth reading.
Paper: Gui, Respi, Abbiati et al., University of Milano-Bicocca + University of Brescia + Centro Studi Socialis, “Longitudinal effect of early social media use on standardized learning outcomes during school career,” Nature Human Behaviour, 2026, DOI10.1038/s41562-026-02522-4, open access (CC BY 4.0).
All numbers come from the original §Results, Table 2, Figures 1–2, and the Reporting Summary. Statistical quantities (standard deviations, p-values, 95 percent confidence intervals) are explained at first use. “Half a school year” is a common convenience conversion; the authors explicitly note it is not an official equivalence.