
【Important notice up front】The paper we read is NBER Working Paper No. 35662 (August 2026). It hasnot been peer-reviewed, and the conclusions are still “pending verification.” What the paper does have is one hard thing: access to the U.S. CDC’s restricted natality files — the records of every single newborn in the country, which regular researchers can’t touch. Read every conclusion below with those two words in the back of your mind.
The argument everyone is having — one place stopped arguing and just did it
For the last few years the whole world has been arguing the same question: should we tax junk food, to push people toward eating healthier? The yes side waves around public-health data. The no side waves around personal freedom and economic efficiency. They argue, and argue, and basically just talk. But one place, ten years ago, stopped talking and actually wrote the law. A decade later, a group of researchers got their hands on data nobody else could get, and went back to look at the result.
That place isn’t a city. It isn’t a wealthy country. It’s a place you may have never heard of: the Navajo Nation, the largest Native American reservation in the United States.
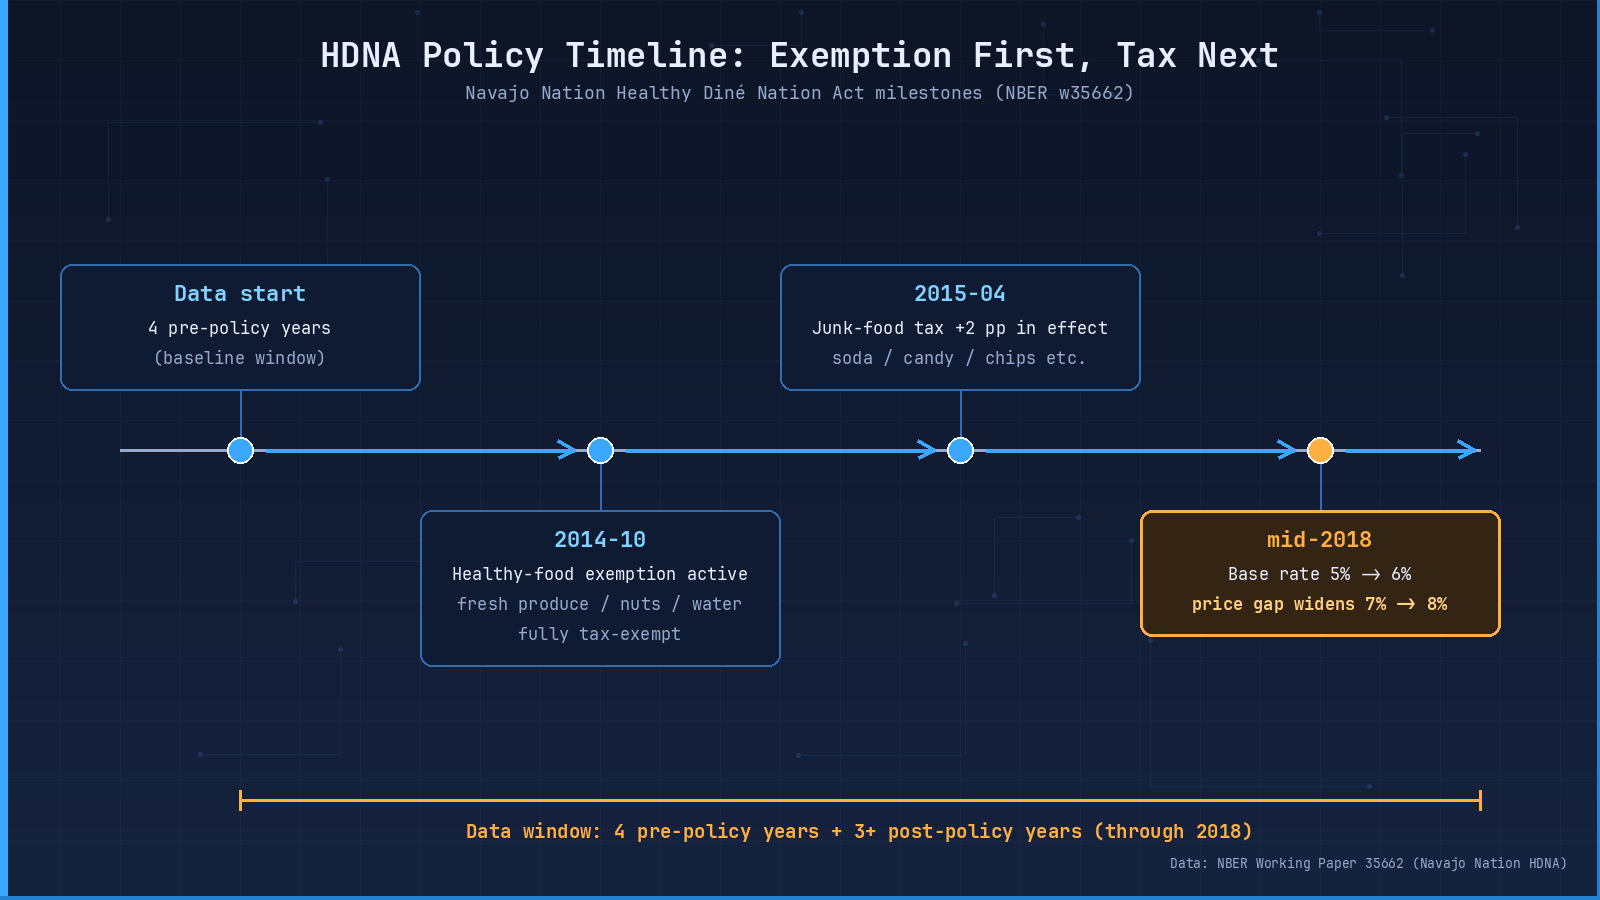
Figure 01: the four key policy nodes. Note the price wedge runs in two stages — 7% from 2015 to mid-2018, widening to 8% after the mid-2018 base-rate increase from 5% to 6%.
If “tax junk food to push people to eat healthier” is real, this is exactly the place where it should have shown up. The reason is brutally simple: diabetes here runs at roughly four times the U.S. national average; about three quarters of residents have, at some point, lived with food insecurity; supermarkets are few, fresh produce is scarce, fast food is everywhere. The USDA classifies most of the reservation as a food desert. If you ever wanted a real-world test of fiscal policy for healthy eating, this is the “promised land.”
But the result, when the data came in, doesn’t match most people’s intuition.
My reading(here and below): the people arguing about this — pro-tax and anti-tax — actually share the same underlying assumption. They both assume: write a tax on paper, the price signal travels to consumer behavior, behavior travels to health outcomes. The paper is really asking, with one piece of data nobody else has, whether that chain actually works. We walk the chain step by step below, and see where it broke.
What the policy actually was: two prongs
The Navajo Nation’s law is called the Healthy Diné Nation Act (HDNA below). “Diné” is what the local people call themselves; it just means “the People.”
HDNA is a two-pronged strategy, and it’s different from the city-level “sugar-sweetened beverage tax” model.
Prong one, starting October 2014: fresh fruit, fresh vegetables, nuts, seeds, nut butters, water — all of it goes sales-tax-free. Note: this is “tax-free,” meaning the price the consumer actually pays drops by a real amount.
Prong two, starting April 2015: on top of the existing sales tax, an extra 2 percentage points get added to soda, energy drinks, sweetened tea, candy, cookies, baked goods, ice cream, pudding and gelatins, chips — what the paper calls, in its own words, “foods of minimal-to-no nutritional value.”
Once you stack the two prongs, you get a hard “price wedge” between healthy and unhealthy food. From 2015 to mid-2018 that wedge is about 7 percent. After mid-2018, when the base sales tax rises from 5 percent to 6 percent, the wedge widens to about 8 percent.
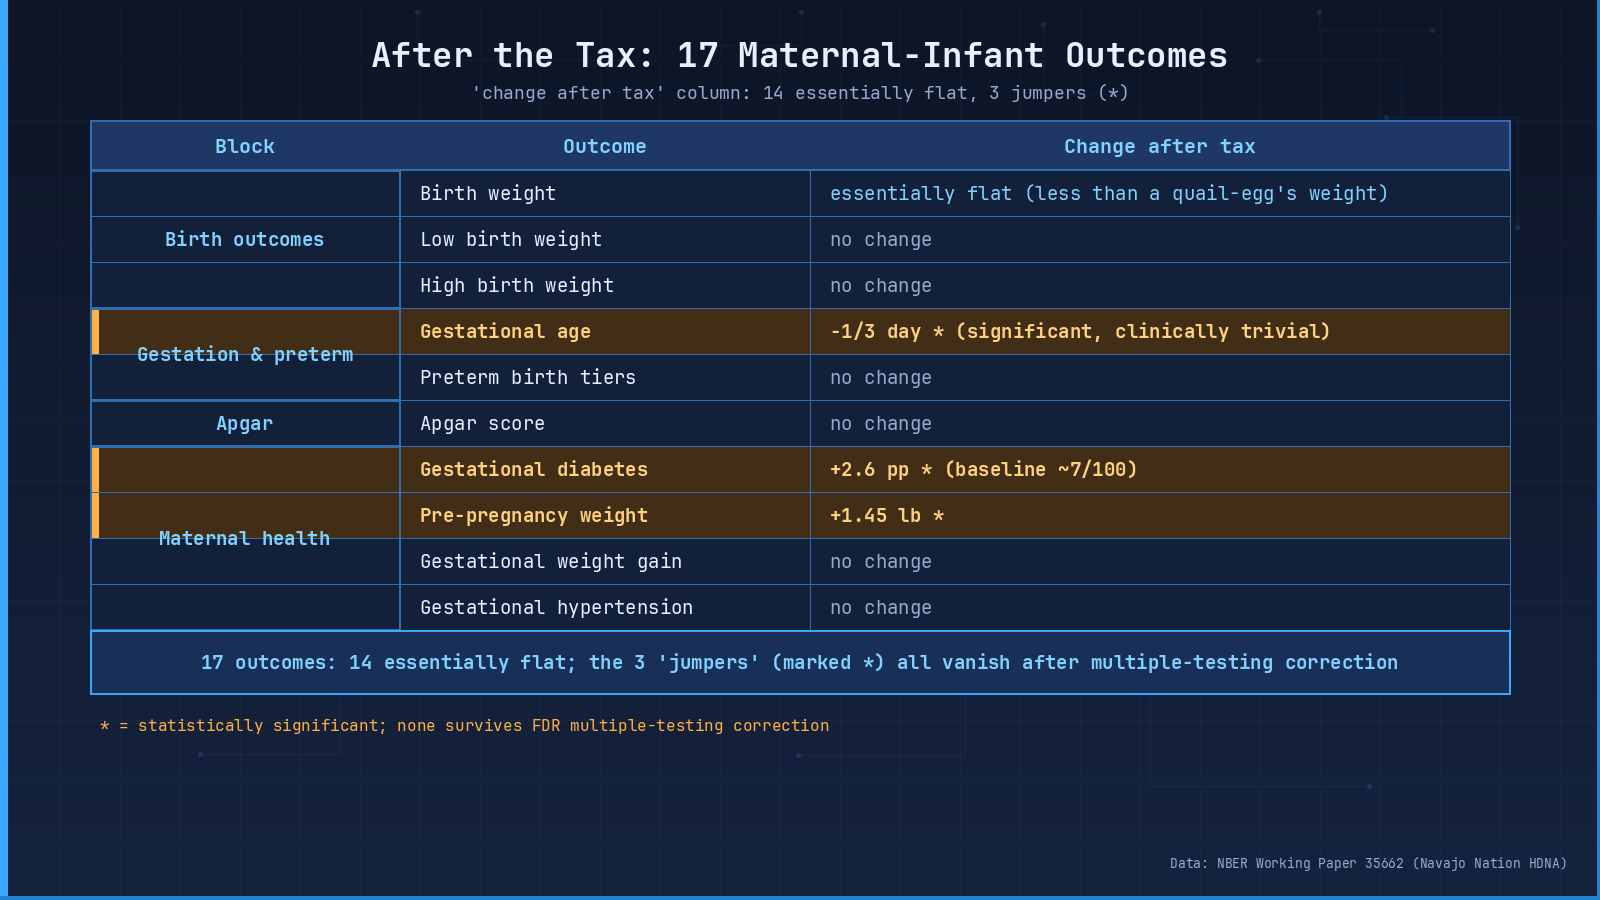
Figure 02 caption: Outcomes grouped by domain — birth weight / prematurity / Apgar / maternal health. Shading matches effect magnitude. The two “wrong-way” nubs on the maternal side are easy to misread; pair this figure with the multiple-testing note below.
My reading: most people’s first reaction to HDNA is “only 2 percentage points, isn’t that too small?” But there’s a detail that’s easy to miss. That 7-8 percent “price wedge” isn’t a single rate; it’s the combined effect of a tax cut on healthy food plus a tax hike on junk food. A can of soda might go up 2 percentage points; a bag of apples might go down 5 percentage points. Side by side, the consumer is staring at a real switching incentive. So if even this incentive fails to show up in the health data, the problem almost certainly isn’t “the rate is too small.” It’s somewhere else.
How to compare fairly — find people who are the same in every way except for this tax
So you have the data. How do you actually compare? You can’t just compare the reservation before and after — over ten years food prices also rose, habits changed, life happened. You can’t tell who to blame.
The researchers’ approach is brutally simple: find a group of people who are almost the same in every way, except for this tax. They pulled 44,308 newborns whose mothers self-reported as American Indian and lived in the Navajo Nation’s nine counties. They also pulled 142,754 newborns whose mothers are also American Indian, but living in other reservations or tribal counties — same kind of people, same kind of life, just without this tax on top of them. Each side compares before and after, then they subtract the two changes. That design is called difference-in-differences, and the logic fits in one sentence: strip out “everything in the country is changing,” and what’s left is “only this tax is moving.”
One detail the authors flag themselves: among the 44,308 treatment-group newborns, not every mother is fully embedded in the nine-county reservation’s daily life — some live on the outskirts, with limited real exposure to HDNA. So the authors call their estimate an “intent-to-treat” effect: the effect under the policy’s intent to cover, which gets diluted relative to the effect on people who are truly fully exposed. That matters: it shows the authors know exactly what their “exposed population” is.
The study also measures 17 maternal-and-infant health outcomes — birth weight, low birth weight, high birth weight, weeks of gestation, the full ladder of prematurity, newborn Apgar score, pre-pregnancy weight, gestational weight gain, gestational diabetes, gestational hypertension. Seventeen outcomes, densely packed.My reading: 17 isn’t a number pulled out of thin air — it’s large enough that “by chance one or two will pop” is the default expectation. It gives multiple-testing correction something to chew on, but it also gives the discussion of “which ones are real” plenty of room. We come back to this.
On the babies’ side: nothing moved
Start with the babies.
The before-and-after difference in average birth weight, once you convert units, comes out to less than the weight of one quail egg. Every birth-weight category (low, very low, healthy, high) is essentially flat. Prematurity rates don’t move. The newborn Apgar score — the one-minute and five-minute post-delivery rating — doesn’t move either.
The one thing that looks like it moved is weeks of gestation: after the tax, average gestation shortens by about one-third of a day. That number is statistically “unlikely to be pure chance” — but any doctor will tell you one-third of a day has zero real-world meaning. Researchers call this “statistically significant but clinically negligible” — don’t let the word “significant” scare you; it doesn’t mean “serious,” it just means “unlikely to be pure noise.”
If you plot each year on a timeline and run an event study, there’s no step at the policy date. One line: on the babies’ side, nothing happened.
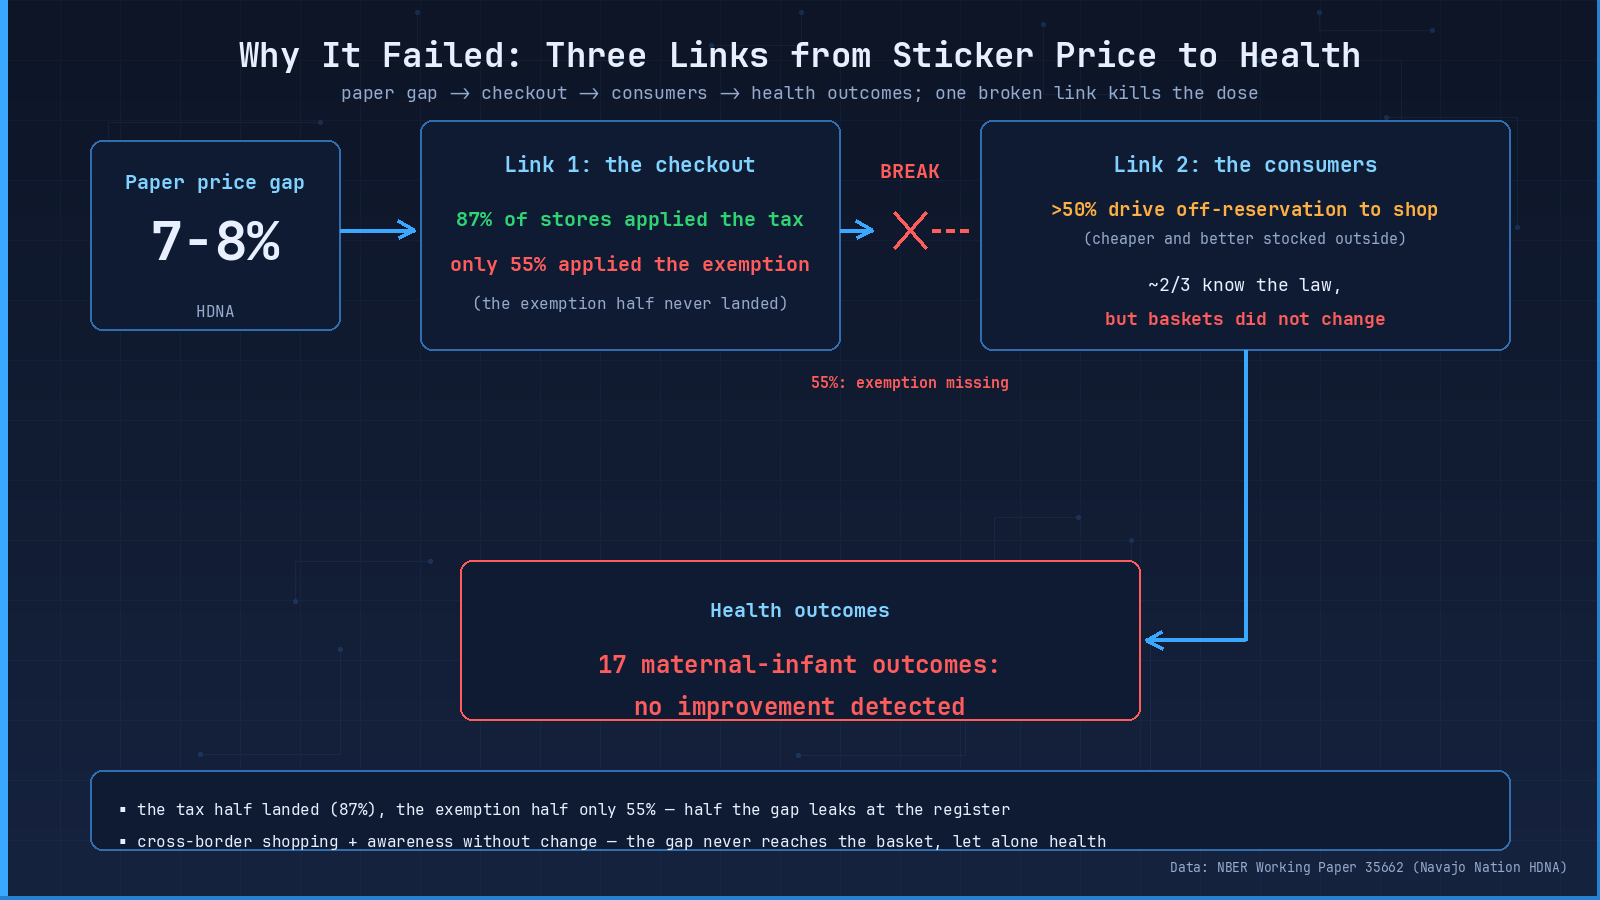
Figure 03 caption: The transmission chain “price wedge → register execution → consumer behavior” drawn as three links. As long as one link disconnects, the chain breaks. The 55% number is the smoking gun on the execution link.
My reading: this is the place in the paper where I want to slow down for one second. Outsiders usually hear “no effect” and translate it to “the policy is useless.” But the authors here use a very disciplined phrase — they say “no improvement was detected, and the ruler was precise enough to rule out moderate-to-large effects.” Both halves of that sentence have to travel together. Drop either half and you mislead. Drop the “detected” half and readers will assume “they couldn’t measure it.” Drop the “precise enough” half and readers will assume “they measured something.” Together, the meaning is — the effect either doesn’t exist, or it’s smaller than this ruler can resolve; on the mother-and-baby-health slice, anything “moderate-to-large” can be ruled out, but a fraction-of-a-percentage-point whisper is below the ruler’s resolution. Keep both halves.
On the moms’ side: two numbers went up, but hold on
On the mothers’ side, two numbers actually did move — and they moved the wrong way.
The rate of gestational diabetes: out of every 100 mothers, roughly 7 before the tax, and the estimate is that 2 or 3 more show up after. Pre-pregnancy weight ticks up by just over one pound. Hearing this, is anyone about to say “the tax didn’t just fail, it actually hurts”?
Hold on.
When you test 17 outcomes at once, pure chance is going to make one or two pop out as “significant” by accident. Run the standard multiple-testing correction — the procedure that says “I tested a lot of things, let me adjust for that” — and every one of those pops flattens to zero. Under more conservative inference (randomization inference and placebo inference), the gestational-diabetes number still leaves a faint shadow — but the authors themselves say clearly: that shadow is not enough to overturn the overall “we didn’t see an effect” finding.
So in this piece, we are not putting words in the authors’ mouths and claiming “the policy hurt people.” That conclusion doesn’t hold up in this data.
My reading: this is the most easily-misread part of the paper — and also where I think the authors are being the most professionally honest. They could have buried or softened the “wrong-way” numbers; instead they put them in plain sight and explained exactly why they shouldn’t be taken at face value. That kind of discipline is rare in policy research. Reading it actually made me trust the rest of the paper more. Researchers willing to flag numbers that look bad for their own conclusion, and walk readers through why those numbers don’t carry the weight they seem to, are usually doing honest work.
Is the ruler too blunt — what can this ruler rule out
By this point you might be asking a perfectly reasonable question: is the ruler just too blunt, and a small effect just slipped through the cracks?
The researchers thought of this. They specifically calculated how precise their ruler actually is. What can it rule out?
If there had really been an effect as big as the ones seen from U.S. city-level sugary-drink taxes — the kind of result Jackson et al. (2023) reported, where after a few big cities taxed soda, gestational diabetes dropped by 2.2 percentage points — this dataset absolutely would have caught it. But it didn’t. In other words: it’s not that the ruler is too crude. It’s that no big effect showed up at all.
To be fair: a tiny effect, fractions of a percentage point, this ruler really can’t measure that. So nobody can claim “absolutely zero impact.” “No improvement detected” and “precise enough to rule out moderate-to-large effects” — both halves have to stay. Drop either half and you mislead.
My reading: this is the moment where the paper’s “insider jargon” gets translated into human. Most readers don’t know what “statistical power” or “minimum detectable effect” means. But once you accept that “a ruler has precision, and precision corresponds to a specific magnitude of effect,” everything downstream — “why a negative result is informative” — clicks. My suggestion, if you take one thing away from this section:a “negative result” plus “adequate power” equals a real finding. Only a “negative result” plus “inadequate power” equals “we learned nothing.“This paper is the former.
Why it failed, reason one: the checkout counter didn’t deliver
That 7-to-8 percent price wedge on paper — what did it actually look like in the store?
Later, the local epidemiology center audited shops: 87 percent of stores did correctly charge the extra tax on junk food — that half of the policy worked. But only 55 percent of stores actually delivered the healthy-food tax break. One of the two prongs just never came down at the register.
Standing in front of the shelves, soda got more expensive — but water did not get cheaper. The “healthy got cheap” half you were expecting, most of the time, didn’t happen.
My reading(speculation flagged): this is the place where I’d give one operational reminder to anyone thinking about pushing a “tax to promote health” type policy — but [my speculation, unverified] on what would help, the paper doesn’t go this far: whether the policy works has nothing to do with the rate written on paper; it has everything to do with what actually happens at the register. The first question to ask, if you’re pushing a similar law, isn’t “how high should the rate be?” — it’s “how do you make sure frontline staff actually execute the tax break?” The technical reason: a tax is machine-automated — the POS adds it and nobody thinks twice. A tax break requires the cashier to categorize the item correctly, the POS to apply the exemption correctly, and the receipt to display it correctly. Break any one of those and the consumer never sees the price wedge. Smart design, dumb execution, equals idle machine.
Why it failed, reason two: legs belong to the consumer
Reason two: legs belong to the consumer.
An estimated majority of reservation residents drive outside the boundary to do their grocery shopping — outside, prices are lower, and fresh food is more available. The earlier work the paper cites (Landry 2015) puts cross-border shopping as a meaningful cost-saving strategy for the population. The policy can control the shelves inside the reservation. It cannot control the steering wheel.
City-level sugary-drink taxes actually face a milder version of the same problem — consumers drive across the city line for cheaper soda — but for the Navajo Nation, “across the border” is tens of kilometers; the dollar savings are also larger, because what changes across the border isn’t just the tax, it’s the entire underlying cost structure (rent, wages, wholesale). So the leakage is bigger here.
My reading(speculation flagged): this is really a common-sense caution for any “differential tax rate inside a small geographic area” policy — but [my speculation, unverified] on the “consumption radius > administrative boundary” claim, the paper doesn’t make it explicitly: in cities, a soda tax can partly block leakage because the “drive-to-evade” distance is short; in a reservation, the “drive-to-evade” distance is tens of kilometers and the savings are higher, so leakage is more aggressive.For any population whose consumption radius exceeds the administrative boundary, “a tax rate that lives inside the boundary” is a structurally flawed tool.Designers who look only at the rate and not at the consumption geography will end up diluted, the way HDNA did.
Why it failed, reason three: knowing isn’t switching
Reason three: knowing isn’t the same as switching.
A 2018 community survey found about two-thirds of residents had heard of the law — but hearing about it and changing your shopping cart are two different things. The basket didn’t move.
The authors also flag something more awkward. For the lowest-income families, that extra tax money may have actually squeezed the budget they had for buying vegetables. And middle-income families may have shifted from cooking at home to eating out — restaurant food tends to be more calorie-dense. Neither of those is what the policy designer intended, but both could plausibly happen.
My reading: this one made me more skeptical of the “information → behavior” transmission in general. We often assume that if you tell people what’s good for them, they’ll do it. But a 30-second grocery decision gets shaped by mood, hunger, kids in tow, the placement of the discount shelf, and a dozen other variables. A 67% “awareness rate” sounds great — it solves the “knowing” side, but it doesn’t solve the “moment-of-decision” side. Health communicators have spent ten years learning this:education is not intervention.Same logic carries over to fiscal policy: even when awareness goes up, the intervention effect doesn’t automatically follow.
Stories from elsewhere — it’s not “taxes never work”
Before you jump to “taxes don’t work,” look sideways at other places. You’ll see this isn’t a simple yes/no.
Mexico, the same year, added an 8 percent tax on non-essential foods; purchases actually fell by about 5 percent. Several big U.S. cities’ sugary-drink taxes saw real drops in gestational diabetes and gestational weight gain — the kind of hard result where a 2-percentage-point tax buys a 2.2-percentage-point drop in gestational diabetes. Even more striking is the U.K.: when wartime sugar rationing ended in 1953, scientists compared kids who spent the first thousand days from conception in the rationing era with those who didn’t. The rationing-era kids had about a 35 percent lower risk of diabetes as adults.
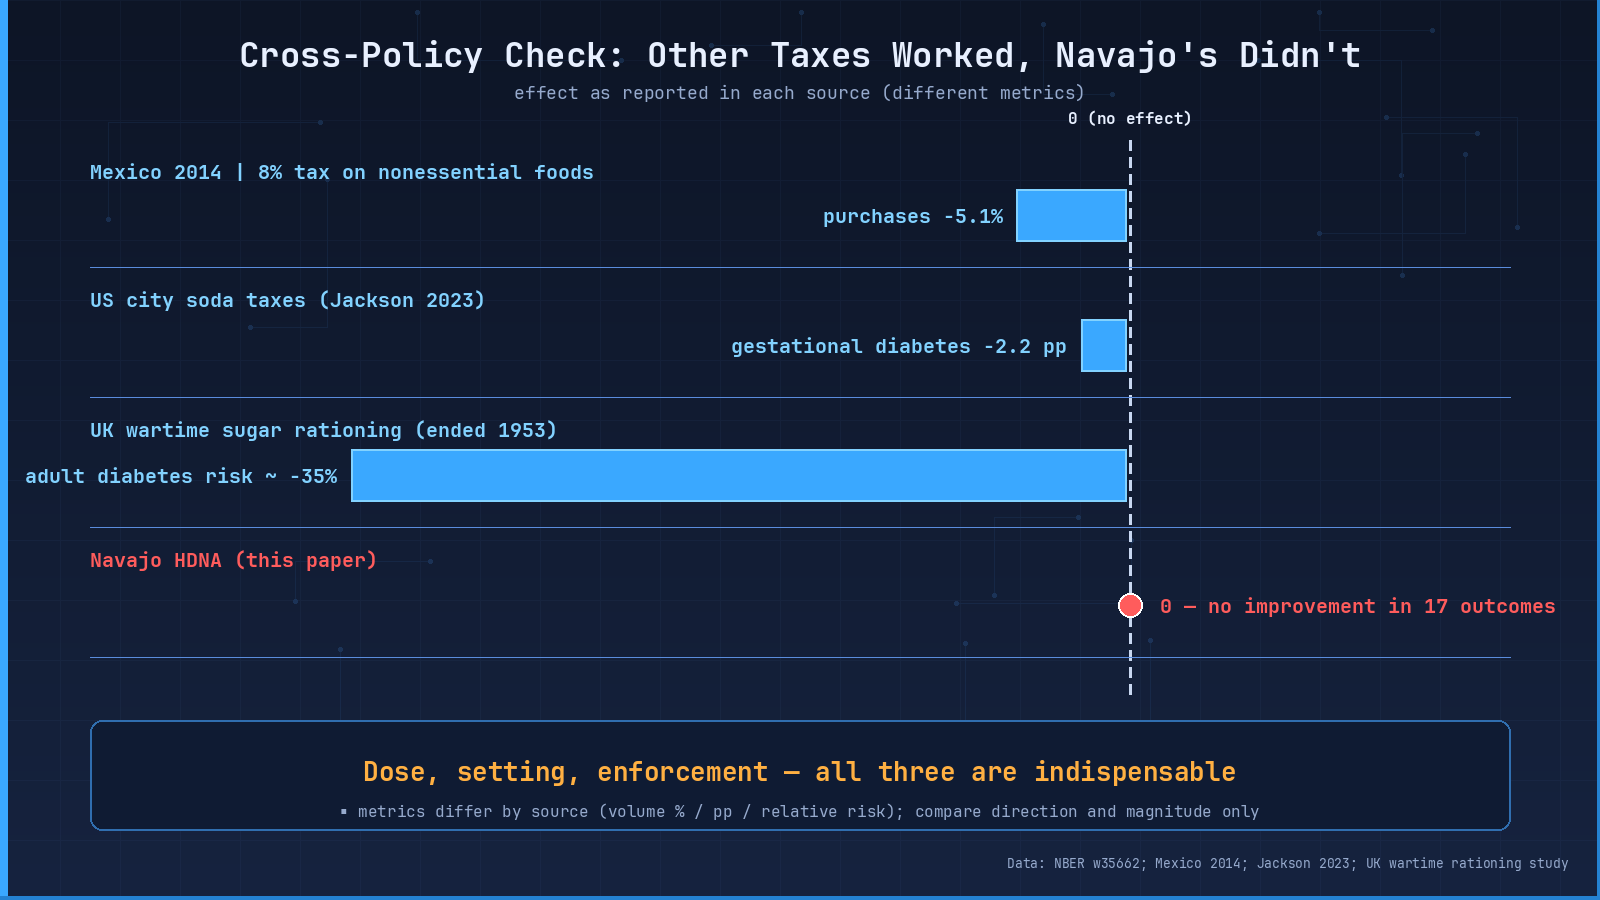
Figure 04 caption: HDNA placed alongside three “same theme, different setting” fiscal or rationing policies. Y-axis is “effect on a key maternal/long-run health metric.” HDNA sits at zero; the others span 2 percentage points to 35 percent. The spread comes from dose, setting, and execution — three variables that have to line up.
So the full story isn’t “taxes never work.” It’s that dose, setting, and execution — all three matter. The Navajo’s 7-to-8 percent price wedge, a short window of years, a tax break that never fully landed, plus a shopping cart that crosses the border — it all got watered down.
My reading(speculation flagged): this is where the paper has its highest public-policy value — but [my speculation, unverified] on the “three variables” framing, the authors don’t actually list these three as a diagnostic checklist; they discuss the failure mechanisms separately. What I took away isn’t “HDNA didn’t work,” it’s a diagnosis: health-fiscal policies need three variables to align — dose (a big enough price wedge), setting (a consumer geography that doesn’t easily leak), and execution (register-side reality). All three aligned, you can see the effect; one of them slips, the effect dilutes below detection. That gives a clear diagnostic for “why so many apparently-good policies end up looking useless in the data.” A diagnostic like that is worth more than picking a side.
Wrap: use the ruler, don’t pick a side
Back to that argument from the start: should we tax junk food?
Ten years on the Navajo Nation gave us not a yes or no, but three things that are more useful.
First, this was the most comprehensive real experiment in the U.S., and on the mother-and-baby-health slice, ten years later, no improvement was detected — note the “detected,” and pair it with “the ruler was precise enough to rule out moderate-to-large effects.” Both halves have to travel together. This dataset can’t tell you what would happen in other settings, with different doses, different execution. And remember — it has not been peer-reviewed yet.
Second, whether a policy works has nothing to do with the rate written on paper. It has to do with what actually happens at the register. The tax-break half never landed, consumers drove across the border, the price wedge evaporated.
Third, next time you hear “this policy definitely works” or “this policy definitely doesn’t,” you’ve now got another ruler: ask first about execution rate, where people actually shop, and whether the dose is big enough. That ruler is worth more than picking a side.
Important boundaries (writing-required disclosures)
- Not peer-reviewed: the paper is NBER Working Paper No. 35662, August 2026,not peer-reviewed. All conclusions are “pending verification” status.
- Outcome scope: this study measures only one slice — maternal and infant health. Childhood obesity, adolescent diabetes, adult cardiovascular events, and other health dimensions are outside the study’s measurement range.
- Data window: data extends through 2018, deliberately stopping well before the COVID-19 pandemic. Do not extrapolate to 2020 or later.
- Population specificity: the Navajo Nation is a special population — diabetes at four times the national average, about three quarters of residents food-insecure, and a “differential tax inside a small geography” setting that has limited representativeness.
- No generalizability to other policies: this study only answers the question “what happened to maternal and infant health in this particular population, this particular time window, this particular implementation?” It does not answer “what would happen in other populations, other doses, other execution?”
- No health advice: this article does not recommend any dietary or health behavior, and does not take a position on whether other fiscal diet policies should be adopted. The authors themselves write “this paper does not offer policy recommendations per se.”
- Help resources: this piece does not deal with mental health or sensitive topics, but if you have any concerns about pregnancy or birth-outcome metrics, please consult your obstetrician or local public health authority — this article does not serve as any kind of medical consultation.
【Citation】Cawley, J., Dreyer, M., & Simon, K. I. (2026). “The Impact of Fiscal Policy to Promote Healthy Diets: Evidence from the Navajo Nation.” NBER Working Paper No. 35662. http://www.nber.org/papers/w35662