
Same floor, two doors, one corridor between them. A Shenzhen agent might push both listings on you at once: one asks three million, the other nine hundred thousand, with the same floor area, the same layout, the same building age, and even the same orientation. The question that stumped me before I read this paper was blunt —is the gap between these two flats the location, or something else?
The paper answers without hedging: the gap is the paperwork.The sales market prices property rights protection; the rental market does not.Two flats facing each other across a corridor differ by roughly three times when you buy them, and by twenty-three percent when you rent them. The gap between “three times” and “twenty-three percent” is exactly what this paper sets out to measure.
For an ordinary reader there is only one payoff: the next time two flats in the same neighbourhood carry wildly different asking prices, you will know which question to ask — not “is this a good estate”, but “what differs between the two title deeds, and how much has the market charged for that difference”. Whether to buy is still your own call; this paper only explains how the market prices things.
First, pin down what this research is, because it decides how much weight every number below can carry. It isNBER Working Paper 35797 (2026-09), DOI 10.3386/w35797— aworking paper, not peer reviewed: a draft circulating inside the profession to be poked at; it is not a published article you can cite as settled. The authors are two economists at American universities and one at a Chinese university; this piece relays their estimates strictly on the paper’s own terms and lets no institution endorse the conclusions.
1. Why Shenzhen has flats facing each other across a corridor
Two words first, because everything later leans on them.Full property rightsmeans a flat with a formal deed, a seventy-year land-use term, that can be sold normally and used as collateral.Limited property rightsmeans a flat built on collective land, where you only hold the right to live in it: it cannot be traded normally, cannot back a loan, and carries no guarantee when it is demolished. In law these are different kinds of asset. In Shenzhen they live in the same building.
Shenzhen was not born this way; it is the residue of thirty years of land acquisition. Before 1979 the whole city was still rural, and acquisition dragged on for three decades, so full-rights and limited-rights estates grew into each other, door facing door. In other cities limited-rights housing sits on the urban fringe; Shenzhen is the exception, with no second case like it in the country.
The stock figures are worth remembering. On the national statistics bureau’s estimate, limited-rights dwellings are roughly 20 percent of China’s housing stock, and as high as 60 percent in Shenzhen.Both percentages also include villagers’ own extensions and units’ self-built housing— other incomplete-title stock — so they must not be read as “sixty percent of Shenzhen is limited-rights housing”. Two further conditions made the city usable for research: in 2015 Shenzhen ran the country’s first building census, counting every block and every estate; and a local household may buy at most two full-rights flats, while limited-rights housing is not subject to purchase restrictions at all.
A door-to-door layout hands you a natural comparison for free, but before it can carry an argument the two groups have to be standing on the same starting line.
2. Getting the two groups onto one line
The base is570,458 property listingsspanning January 2015 to December 2017 — 275,224 full-rights and 295,234 limited-rights — scraped from several platforms, de-duplicated, with asks above one hundred million or below ten thousand dropped as extreme. One convention must be nailed down here: every price in this paper is alisting price, meaning the owner’s asking price rather than the final transaction price.
At the estate level the data comes from that census: of 4,615 estates, 3,822 survived cleaning — 3,173 full-rights (86.2 percent), 430 limited-rights (11.7 percent), and 219 held by government, the military or state firms, which are excluded from the analysis. The matching rule is plain enough: give every limited-rights estate a neighbour on the map, pairing it with the nearest full-rights estate inside one kilometre, or the nearest one inside two if the first was already taken, producing338 pairscovering 335 full-rights and 392 limited-rights estates.
Matching alone is not enough, because the flats themselves differ. The paper runs ahedonic regression— lay out the visible attributes (floor area, orientation, floor level, construction year), price each one, and let whatever remains fall to the title deed. Its matching-quality figure shows no systematic difference between the two groups on four attributes: unit size, community floor-area ratio, community age and number of households (the paper’s Figure 2).
Transaction prices come from a separate set: 13,316 actual full-rights contract prices from one leading agency. Agency contracts were necessary because the widespread practice of signing dual contracts to dodge price caps makes official filing prices badly distorted, and limited-rights housing has no official transaction record at all. With the starting line levelled, price walks in and leaves the gap behind.
3. Buying costs three times as much
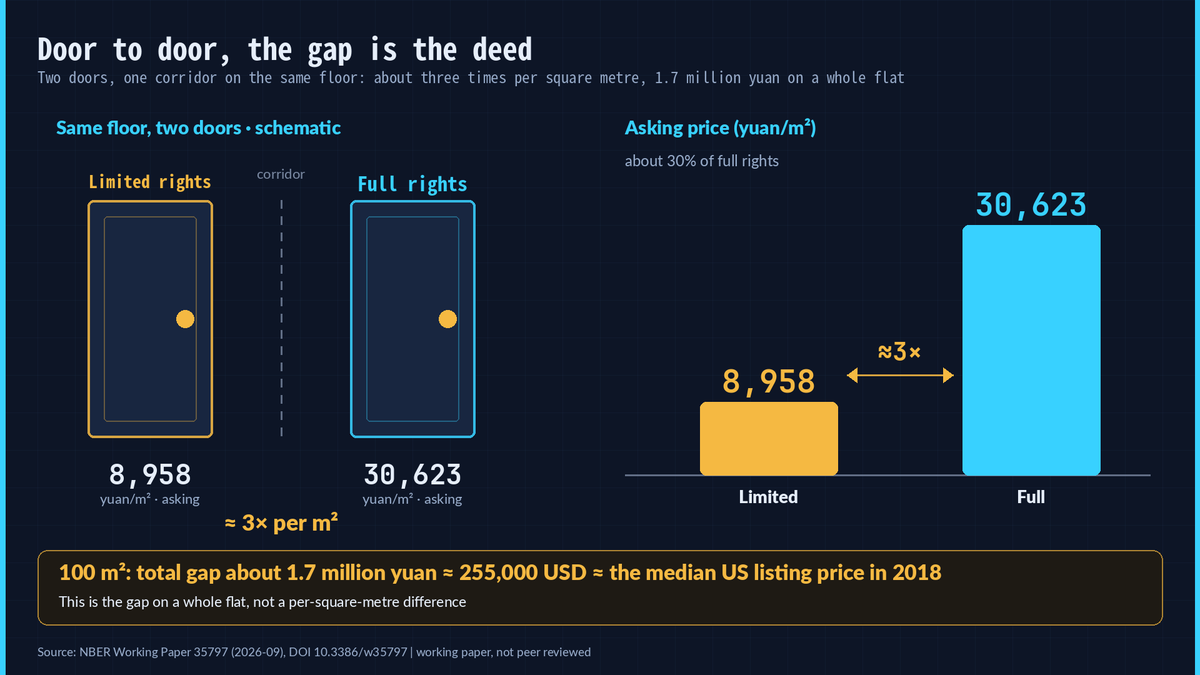
Door to door, the average asking price is8,958 yuan per square metrefor limited-rights flats and30,623for full-rights ones, the former about 30 percent of the latter. On a 100-square-metre flat the totals differ by about1.7 million yuan, roughly 255,000 US dollars— by the paper’s comparison, about the median home listed for sale in the United States in 2018. The distinction matters: the 1.7 million is thegap on a whole flat, not a per-square-metre difference.
Pull back and the number gets a scale. A footnote supplies an income comparison: median US household income was 60,309 dollars in 2016, while per capita urban income in China was 4,944 dollars. A price gap equal to another country’s house would draw a second look in any market.
More interesting is where the three times comes from. The paper runs a second matching inside the full-rights group: each extra year ofremaining leasehold— how much of the seventy-year term is left, counted from the day the developer bought the land rather than the day you bought the flat — carries a 0.44 percent premium in asking prices and 0.35 percent in transaction prices, both significant at the 5 percent level. The average full-rights flat in the sample has about 56 years left; plugging that average into the pricing equation gives a price ratio right at three.
My reading is that the threefold gap has a traceable source: buyers fold the next few decades of uncertainty into today’s price in a single payment. What that uncertainty is actually worth, the market answers more directly elsewhere — start with rents.
4. Renting costs twenty-three percent more
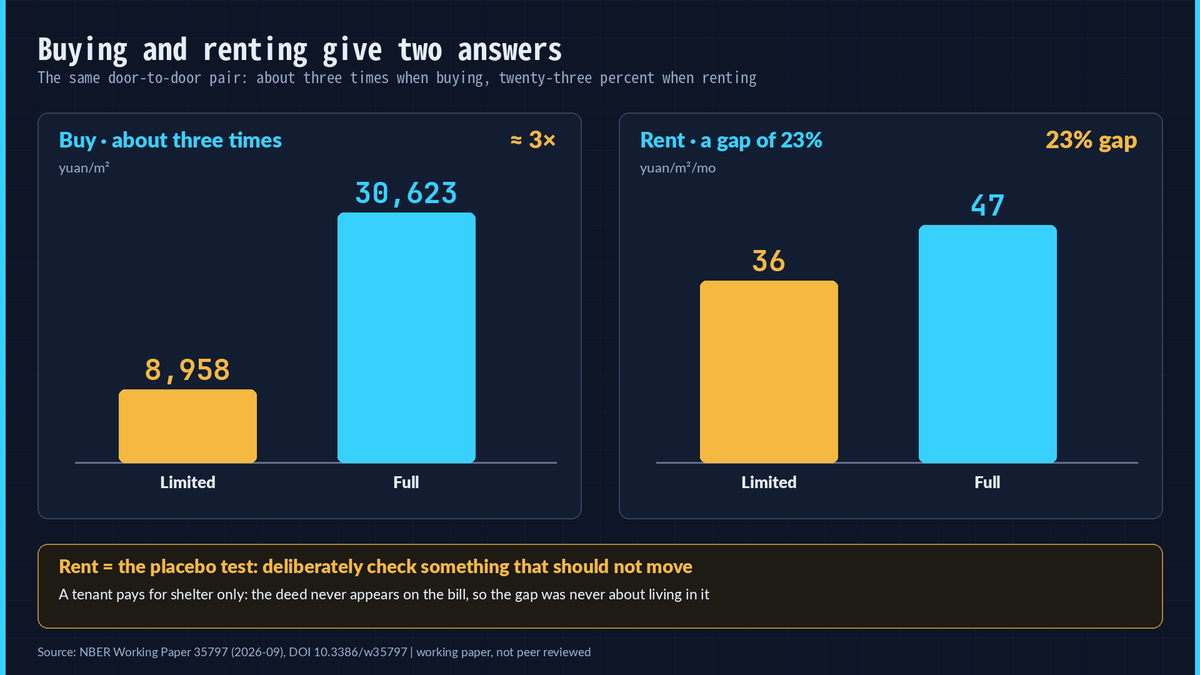
Same door-to-door pair, monthly rent of36 yuan per square metreagainst47, so the limited-rights flat asks about 77 percent of the full-rights one — a gap of twenty-three percent. Buy and the difference is three times; rent and it is twenty-three percent. Same location, same flat, two markets, two answers.
The paper turns this into aplacebo test: deliberately check on something that should not be affected (rent). If it does not move, the price gap was never about shelter itself. Across four specifications the rent gap between the two types is never significant. The sample’s average rent-to-price ratio is 2.6 percent, which the paper reads as renting being far more attractive than buying.
A tenant pays for shelter. Whether the deed is safe, and what happens at the end of seventy years, never appear on this month’s bill; a buyer has to pay for that in advance. The same flat is three times apart when you buy it and twenty-three percent apart when you rent it, and the money parts ways: one buys the next few decades, the other buys only this year. So what exactly is the buyer’s surcharge insuring?
5. What the buyer’s surcharge insures
The seventy-year term on a full-rights flat starts when the developer bought the land, and the years remaining are priced into every trade. Article 359 of the Civil Code, effective in 2021, says residential land-use rights renew automatically on expiry — but how much the renewal costs, and whether it is reduced or waived, was left to later legislation.Automatic renewal settles “will it renew”, not “what will renewal cost”, and that uncertainty still sits inside the price.
The limited-rights ledger is plainer. The paper lists five items: transaction taxes can be avoided (they can reach 10 percent of the sale price), purchase restrictions do not apply, the flat cannot be used as collateral or bought with housing-providing fund loans, a buyer who is not a member of the village collective is not guaranteed access to local schools, and demolition compensation is paid to the collective rather than directly to the owner. Cheap, flexible, tax-free — with no door to a loan and no floor under a demolition payout.
Two title deeds differing by one word were never the same asset from the day the land was bought. Buyers pay three times as much for full rights precisely to outsource two risks: what happens at the end of the term, and whether a demolition is compensated. How the market prices that risk is hidden in two numbers.
6. Two numbers the market put on the two deeds
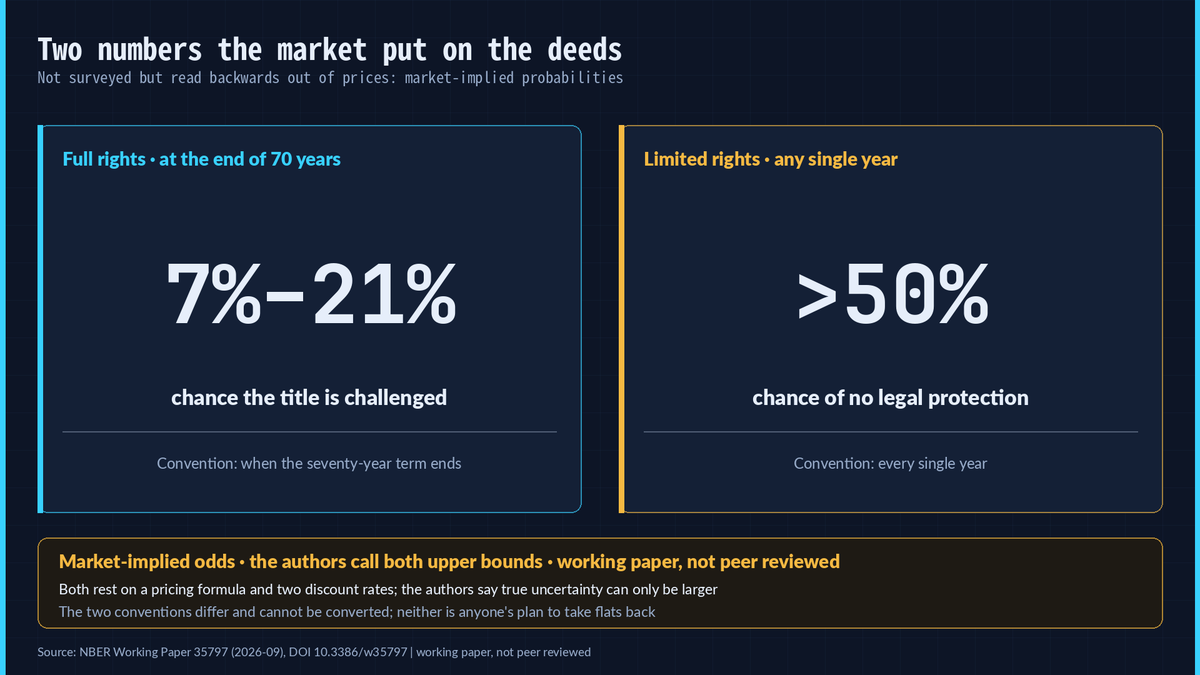
The paper sent out no questionnaire and read no government file. Itworked backwards from prices: if the market believes a risk exists, it shows up in today’s ask. A probability inferred this way is animplied probability— no asking, no documents, just how much room the market has left itself.
The first number: when the seventy-year term on a full-rights flat runs out, the title may be challenged, and the market-implied chance is7 to 21 percent. The second is sharper: the chance that a limited-rights flat receivesno legal protection in any single yearisabove 50 percent. The two conventions differ — one is “at the end of seventy years”, the other is “every year” — and they cannot be converted into each other.
These numbers were computed rather than surveyed, and they depend on a pricing formula plus a discount-rate assumption (the paper reports 3 and 5 percent). Change the assumption and the number moves. The authors also put the caveat up front: if listing prices contain speculative froth or resale-option value, these estimates are anupper bound— the true uncertainty can only be larger, never smaller.
The right reading is therefore: this is not a plan for anyone to take flats back in some future year. It is money the market has already paid, and keeps paying.
7. The less protected, the more it is traded
With the market’s price for risk in hand, the next question is who gets active inside that uncertainty. Two gauges measure how hot the speculation runs. The first is theturnover rate: what share of an estate’s flats goes up for sale each month. Full-rights estates run3.511 percentage pointsbelow their matched limited-rights peers, significant at the 1 percent level; against a sample mean of 12.8 percent that is a difference of more than 27 percent. Even after controlling for estate attributes the gap is still 0.889 percentage points.
The second gauge isprice volatility— how much prices jump around — which the paper measures with a GARCH(1,1) style statistical model that tracks the month-to-month jitter. Full-rights estates sit257.076lower, about 24 percent of the mean of 1087 and 0.32 standard deviations; controlling for estate attributes leaves a gap of 329.437.
A ready-made theory explains the pattern: when buyers disagree about the future and cannot short the asset, bubbles arrive bundled with high turnover and high volatility, and public information that shrinks the disagreement deflates the speculation. The Chinese housing market has both conditions at once — no one has ever published what happens at the end of seventy years, and a home cannot be shorted.The assets nobody can explain are the ones most likely to be used as chips; this is the sturdiest line the data supports.
8. What one published planning map changed
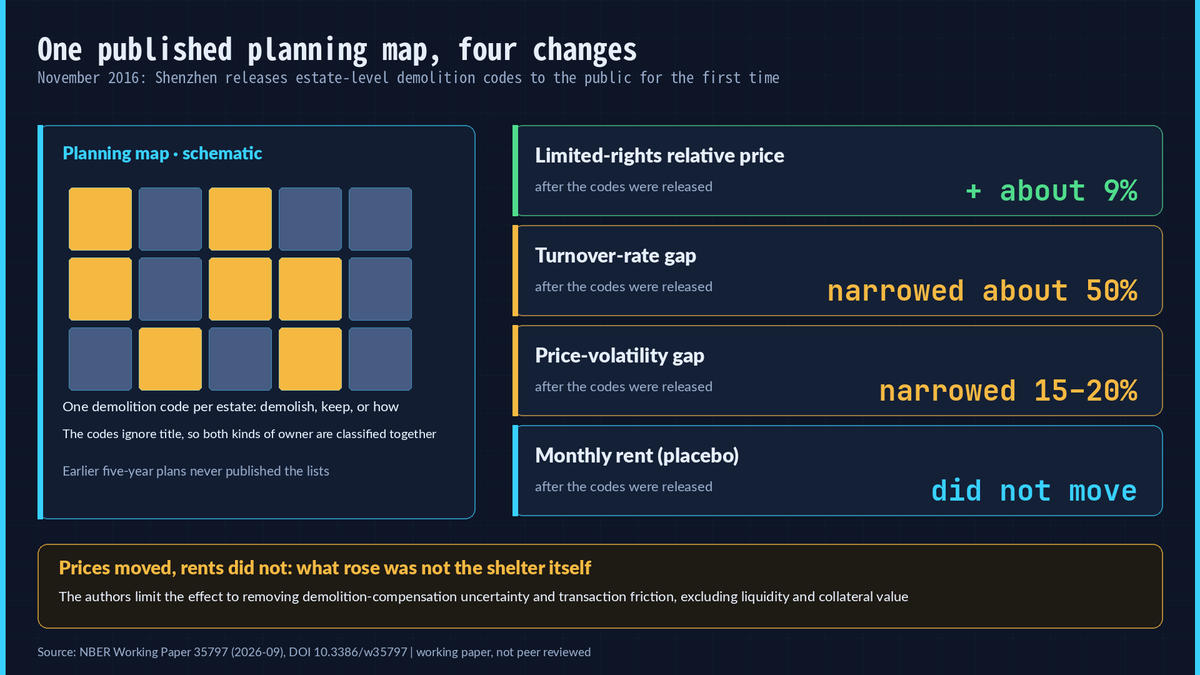
In November 2016 Shenzhen released its 2016–2020 urban planning codes together with the maps, and for the first time the release containedestate-level demolition codes— a classification of what gets demolished, what does not, and how. The two previous five-year plans had only talked about adding supply; demolition lists had never been published. The gap from drafting to release was short, residents and journalists were caught off guard, and the document became the talk of the city the moment it appeared.
The mechanism is not complicated: the codes were assigned by characteristics unrelated to ownership, so both kinds of owner were classified together. Full-rights owners are entitled to compensation in law; limited-rights owners previously risked being demolished with nothing. The new codes gave them, for the first time, an explicit expectation of government taking and paying. The paper estimates the change with adifference-in-differencesdesign — compare before with after, and the affected group with the unaffected group, then read the difference of differences.
Three lines moved at once, in different directions.
On price, the full-rights premium fell by about 8.3 percent, which is the same statement aslimited-rights flats rising about 9 percent in relative price. On rent, the interaction term is insignificant and close to zero — the placebo did not move, so what rose was not the value of shelter. On speculation, the turnover gap between the two narrowed byabout 50 percentand the volatility gap by15 to 20 percent: the two door-to-door types had their temper pulled together by a single document.
The before-and-after story lines up. Before the event, median full-rights asking prices rose 63 percent cumulatively between January 2015 and October 2016 against 5.7 percent for limited-rights; controlling for attributes gives 7 percent against 2 percent. After the event the two series move together, full-rights medians fall 14 percent from December 2016 to April 2017, and limited-rights prices take off from March 2017. Two further checks: among a run of placebo event dates from December 2015 to September 2017 only the real month is significant, and the rent placebo stays flat throughout.
The authors also draw the boundary of the effect themselves: the gain corresponds to the value of removingdemolition-compensation uncertainty and transaction friction, not the value of liquidity or collateralisability. Information is worth money, and in this data it carries a specific price tag.
9. How far can this research be trusted
Set the numbers where they belong before listing the boundaries. This is aworking paper that has not been peer reviewed, and that status says it is a draft. There are also two internal inconsistencies: the same release date appears in three different days in the body, and one percentage in the body lost characters in typesetting. So this piece writes only “November 2016” in public, and always gives the volatility narrowing as 15 to 20 percent rather than quoting the broken figure.
The data has six boundaries, each traceable to the paper.
No transactions are visible. The whole dataset is listing data: whether a flat sold, how long it stayed listed, and at what price are all unknown, and limited-rights housing has no official transaction record at all. No buyers are visible. The paper states outright that for limited-rights listings it knows neither who the buyer was nor whether the sale ever completed, so investors cannot be separated from owner-occupiers. Mechanism identification is limited. For the planning-codes exercise the authors restrict the effect to demolition-compensation uncertainty and transaction friction, and state that the estimate does not include liquidity or collateral value. Conventions depend on assumptions. The 7-to-21 percent and above-50 percent figures rest on a pricing formula and two discount rates, and the authors call them upper bounds. Window and extrapolation. The sample covers 2015 to 2017, and the authors say the market is now mired in a severe downturn; Shenzhen’s door-to-door layout has no national counterpart, the paper promises only Shenzhen’s evidence, and the result cannot simply be carried to other cities.
One more is easy to miss: rent is also a value typed onto a listing page rather than a measured transaction, and the 219 estates held by government, the military and state firms are excluded, so the findings cover only the two title types.
None of the six erases the paper’s findings; they only stamp each number with the confidence it deserves.
10. Reading the insurance line inside a price
Back to those two doors. One asks three million, the other nine hundred thousand, one corridor apart; the buyer stakes the next few decades while the tenant rents only this year; buying is three times apart, renting twenty-three percent.
What this research is for, ordinary reader, sits in one sentence: read the insurance line inside a price. A wild gap inside one neighbourhood is rarely location fighting location — it is two deeds pricing each other. Whether to buy, which to buy, whether it is worth it: the paper does not answer, and neither will this piece. That judgment stays with you.
The authors close with a line worth carrying out unaltered: even full-rights property in China faces far greater uncertainty over property rights than freeholds or leaseholds in developed countries, and clearer guidance on extensions after the current term could be crucial for reducing speculation. Those are the paper’s words. This piece only owes you those words and the numbers behind them, exactly as they stand.
To check it yourself, search the DOI 10.3386/w35797 for the full text (the paper has not been peer reviewed). Prices and rents sit in the descriptive statistics table, and the planning-code estimates sit in the results tables in the middle. If a convention does not line up, or you want the next paper taken apart, say so in the comments.