
A 2026 paper in the Journal of Sleep Research, “Chronic Sleep Irregularity Is Common, Persistent, and Associated With Poorer Sleep Health” (DOI: 10.1111/jsr.70430, OA, CC BY). Authors from Flinders University (Adelaide), Murdoch University, and the Paris Interdisciplinary Sleep Center; corresponding author Hannah Scott. This post is not a stats dump — it’s a working engineer’s read-through of what the paper actually established, and whether you can reproduce the diagnosis from your own wearable data.
1. Weekend Catch-Up: What Kind of Hole Are You Actually Digging
The most common “irregularity” of our generation looks like this: stay up until 23:30 on weeknights, drag yourself out of bed at 7:00 for work, then on Saturday sleep until 11:00 and call that “catching up.” The paper opens by naming this pattern explicitly: weekend catch-up sleep.
It looks like recovery. In practice it adds another layer of oscillation on top of an already-jagged circadian clock. You think you are healing; you are jumping in the same hole.
The kicker is not that you sleep more on the weekend (an extra 1–2 hours on Saturday is not the issue). It is that once the weekday-early / weekend-late tug-of-war becomes the default, it stops being a habit and starts being an independent health risk. The paper’s term for it is “chronic sleep irregularity.” It is not a disease — but the authors treat it the same way clinicians treat “chronic insomnia”: as a chronic sleep problem worth intervening on.
So the obvious next question: how do we know when someone has actually fallen into the hole? The paper gives a hard threshold.
2. How “Irregular” Is Actually Defined — The 90/60 Self-Check
A person is flagged as having an “irregular month” when, in that month, thewithin-person standard deviation of sleep duration is ≥ 90 minutesand thestandard deviation of sleep midpoint is ≥ 60 minutes.
The threshold is not made up. It comes from Huang et al. 2020 and Scott et al. 2023 — past work that showed hypertension and cardiovascular risk climb measurably once you cross these lines. The authors treat the pair as an objective physiological grading, deliberately separated from subjective “did I sleep well?” reports.
The self-check is straightforward. Pull one month of your own data and compute two standard deviations:
- Duration SD: log how long you actually slept each night (e.g. 6.5h, 7h, 5.8h, 8.2h, …) and take the standard deviation. ≥ 90 minutes (1.5h) flags duration irregularity.
- Midpoint SD: midpoint = (sleep onset + wake time) / 2. If you sleep at 23:00 and wake at 07:00, midpoint is 03:00. Compute one midpoint per night for a month; ≥ 60-minute SD flags timing irregularity.
If both lines cross, that month is an “irregular month” you are accumulating. In the paper’s 95,819 participants,more than 15% of the sample spent at least half of their months in this state.
The threshold sounds strict. It is not. Almost everyone who lives the “weekend catch-up” life crosses both lines — they just don’t realize they are being scored on it.
That raises the more important question: where did the 95,819-person, 20-month dataset come from, and can it be trusted?
3. The 95,819-Person, 20-Month Dataset — How It Was Built
The sample is95,819 people, with an average of21.8 monthsof data per person — over 2 million person-months. The device is theWithings Sleep Analyser, a mat placed under the mattress that uses an air-pressure bladder and a microphone to pick up the tiny vibrations of breathing and heartbeat (the technique is called ballistography), and classifies sleep vs. wake.
There is one hard limitation on the device:wake-detection specificity is only 37%. In plain language: it is great at saying “you are asleep” (95% sensitivity), but bad at saying “you are awake.” That means WASO-style metrics may be biased downward and sleep efficiency may be a little optimistic. This is a documented method-level boundary in the validation literature; the authors do not hide it.
Device aside, the sample is also not “the general public”:
- Geography: 30+ countries. Europe 60.2%, North America 30.7%, Asia 6.3%, Oceania 2.3%.
- Gender and age: male 78.3%, female 21.7%; mean age 49.2 years.
- Blood-pressure subsample: 27,700 people (only included if they logged ≥3 BP readings per month).
These are the authors’ own listed limitations: the sample is not random, it is a self-health-tracking population skewed toward middle-aged men in Europe and North America who can afford a Withings sleep mat. Whether the conclusion holds outside this subgroup is an open question.
Prior sleep-irregularity research usually runs 7–14 days; a systematic review found only 32–37% of studies objectively measured sleep regularity at all, and only 15% collected more than 14 days of data. What this paper does differently is stretch the monitoring window to ~20 months per person on average. That is the first time “irregularity as a long-run phenomenon” has been tested on a window long enough to take the question seriously.
The data foundation is long enough, the device is honestly bounded, the methodology is transparent. So what did it find?
4. Four Findings: Common, Worse Sleep, Higher BP, and Stubborn
The paper’s core results compress into four things, ordered by how counter-intuitive they are.
4.1 It is common — 20.8% of person-months are irregular
Across the full 2 million-plus person-months,20.8% satisfy the “irregular month” definition. In other words, 1 in 5 months for the average participant is a “bad” month. And that is the cross-sectional count — it does not yet account for “consecutive irregular months.”
By share of irregular months, the 95,819 participants were split into four groups:
- 0–25% of months irregular: 66,927 (reference group, the largest)
- 25–50%: 13,850
- 50–75%: 7,596
- 75–100% (chronic irregularity): 7,446 (~8% of the sample)
The last group is the protagonist of this paper. 8% sounds small, but multiplied by a 95,819-person base it is 7,446 people — large enough for statistical inference, and large enough to make “this is a real population, not a fringe sample” the right reading.
4.2 Chronic irregularity: more sleep, worse sleep
This is the most counter-intuitive result. Chronic-irregular vs. most-regular group:
- Sleep efficiency 8 percentage points lower(−8.2%, 95% CI −8.2 to −7.8)
- WASO (wake after sleep onset) 39.6 minutes longer(95% CI 38.8–40.4) — almost 40 minutes of extra wakefulness across the night, roughly one TV episode
- Total sleep time 9.8 minutes longer(95% CI 8.4–11.2)
It kills a reflex: people assume “more sleep = better.” The chronic-irregular group slept longer, yet slept clearly worse. “Enough sleep” is not the same as “good sleep” — this paper, on 95,819 people over 20 months, nails that down.
A subtler signal: only the most-regular group (0–25% irregular months) crossed the >85% sleep-efficiency clinical cutoff. The other three groups all sit under that line.
4.3 Hypertension odds 46% higher
On blood pressure, chronic-irregular vs. most-regular:
- Systolic BP**+2.9 mmHg**(95% CI 2.4–3.4)
- Diastolic BP**+1.8 mmHg**(95% CI 1.5–2.2)
- Hypertension (per ACC/AHA 2017: ≥130/≥80 mmHg)odds 46% higher— OR 1.46, 95% CI 1.32–1.62
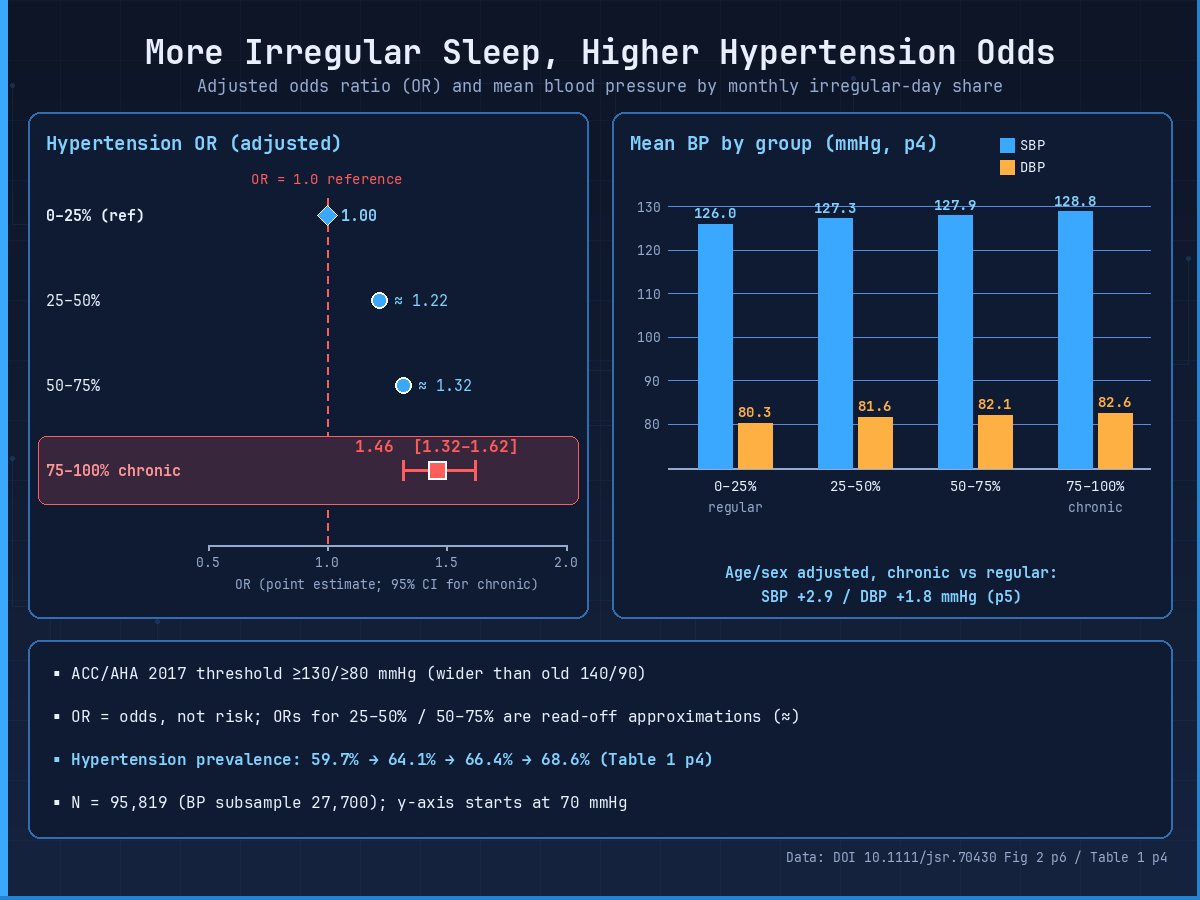
Two precision notes. First, this isodds, not risk — the paper reports an odds ratio of 1.46, not a relative risk. Second, the ACC/AHA 2017 cutoff (≥130/≥80) is wider than the older ≥140/90 cutoff many readers are used to, which is why the headline “61.4% prevalence” looks alarming. The standard is what it is.
Walking up the irregularity quartiles, hypertension prevalence climbs 59.7% → 64.1% → 66.4% → 68.6%. The standard must be cited — this is a choice of threshold, not a sign of data fishing.
4.4 Irregularity is brutally stubborn — 6 months in, the probability of next month being irregular is >80%
This is the paper’s most visually striking finding.
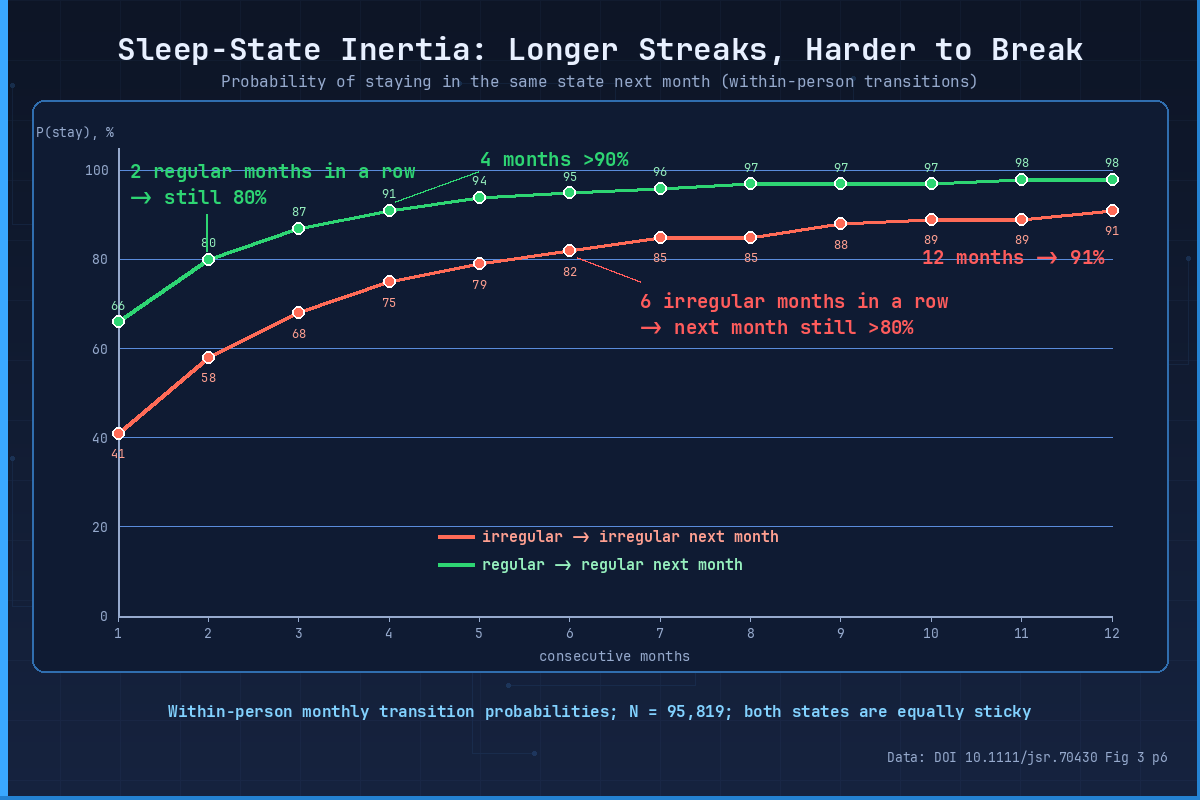
Irregularity has a wide entrance and a narrow exit.After 6 consecutive irregular months, the probability of the next month being irregular is above 80%; at 12 consecutive months, around 91%.Once you slide in, climbing back out is much harder than it feels.
The authors’ own term is “chronic sleep problem” — not a disease diagnosis, but an engineering label for “long-running irregularity.” In the discussion they pin a time anchor: about6 months after onset, irregularity consolidates into a chronic sleep problem that does not spontaneously remit. The intervention window is before chronicity sets in.
The headline number is striking on its own — but that is only the negative side of the curve. Is there good news hiding in the same figure?
5. Good News: Regularity Is Just as Stubborn as Irregularity
The good news sits on the same chart, the other curve.After 2 consecutive regular months, the probability of staying regular next month is around 80%; after 4 consecutive regular months, it exceeds 90%.
Regularity is just as sticky as irregularity. Once you stabilize your schedule, the probability you keep it next month is in the 80–90% band too. That means irregularity is not destiny — adjustment works better than it feels.
This flips the intervention strategy: instead of treating irregularity as a disease to cure, treat regularity as a habit to install. Habits are much cheaper to maintain than cures.
A dose-response confirmation comes from the within-person consecutive-month analysis — same person, counted from their 1st irregular month to their 12th:
- WASO: rises month by month, +13.5 minutes by month 12 (95% CI 13.2–13.7)
- Sleep efficiency: bottoms out around month 4, then plateaus
- Blood pressure: at month 12, +1.3/+1.0 mmHg vs. month 1
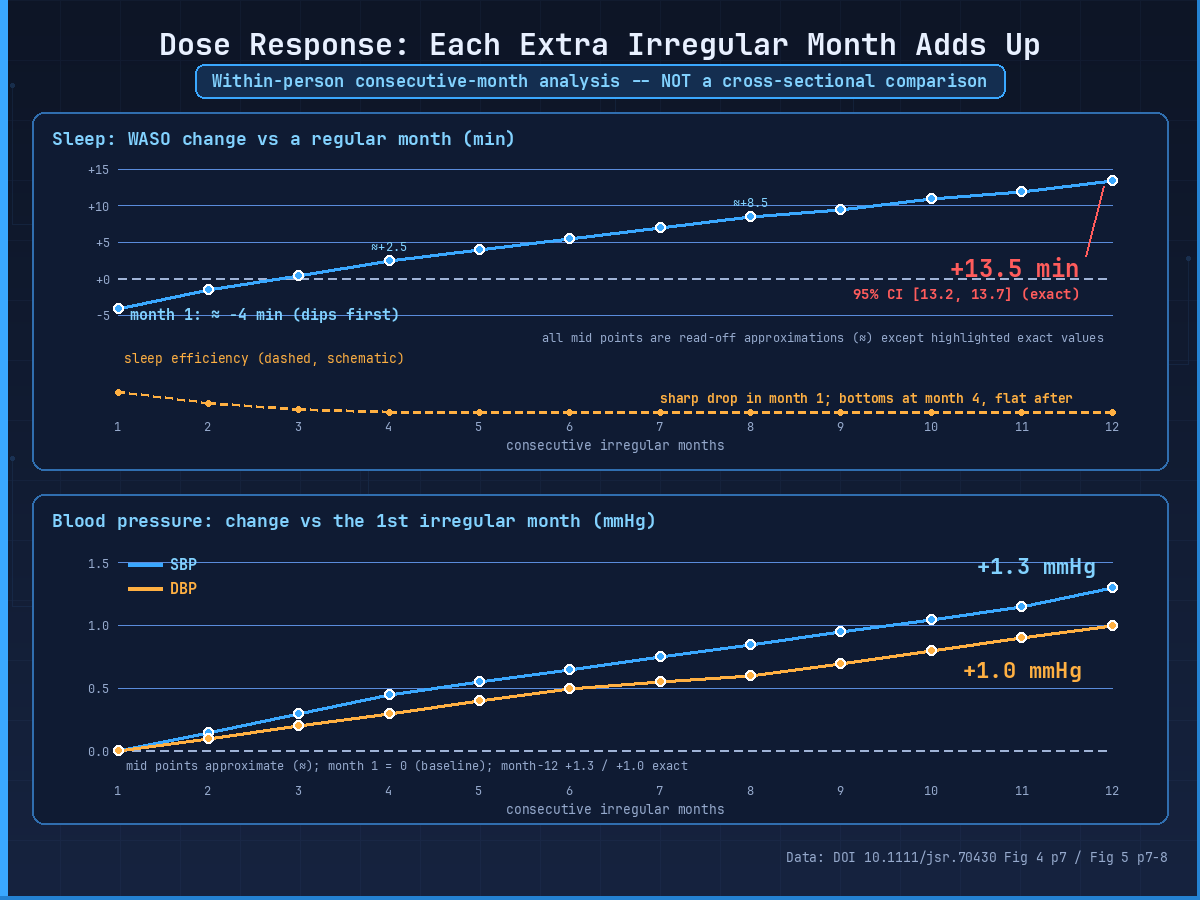
That “6 months” number is empirically grounded here, not a vague “act fast.” Past it, intervention difficulty rises sharply.
So how do you actually use that 6-month window?
6. Using the 6-Month Window — Three Real-World Cases
To be clear: the paper itself does not give prescriptive protocols. What follows is translating the 90/60 self-check and the 6-month window into operating instructions — not a treatment plan the authors wrote.
But the authors do draw an explicit red line in the discussion: before the 6-month mark is the “behavior is reversible” window; after it, the irregular pattern has chronicized. Three practical cases:
Case 1 — office workers with chronically shredded schedules(shift work, social obligations, caregiving). Step one is not “fix irregularity,” it is stabilize sleep onset time. How long you sleep is secondary; what time you close your eyes is the variable that needs to be locked down.
Case 2 — weekend catch-up crowd, weekday already wrecked.Anchor weekend wake-up time to within ±1 hour of the weekday wake-up time. More executable than “sleep less on weekends” is “do not let weekend wake-up drift more than 1 hour past weekday wake-up.”
Case 3 — already 6+ months of irregularity.The paper does not deny this group exists — they are the “already chronicized.” For them the realistic goal is not “restore regularity” but “prevent further deterioration.” Run the 90/60 self-check first, then decide whether behavioral change is enough or whether a sleep specialist is the next call.
Two caveats belong with this section. The three cases above translate the paper’s findings into operating instructions; they are not the authors’ own prescriptions. What is directly usable from the paper is the self-check threshold and the 6-month window — those two numbers come straight from the text.
The 6-month window also flags something the self-check won’t catch on its own: drivers behind irregularity that are not under your behavioral control — shift work, caregiving, delayed sleep phase disorder, sleep apnea. These may be the real upstream variables.
7. Five Boundaries and a Few Things Worth Flagging
This paper is methodologically clean and the question is well-defined, but several boundaries have to be on the table:
One — observational study, no causal claims.All you can say is that irregular sleepers have worse sleep and higher BP; you cannot say irregularity causes either. The authors themselves cite Phillips & Steven 2026 on exactly this point.
Two — sensor specificity 37%.Wake detection is weak; “irregular” classification is therefore slightly lenient, and WASO may be slightly underestimated. The authors do not bury this.
Three — sample bias.Male 78.3%, mean age 49.2, Europe + North America 91%, self-selected health-tracking users who can afford a Withings mattress sensor. Not generalizable to “everyone who sleeps poorly.”
Four — BP threshold.ACC/AHA 2017 ≥130/≥80 is wider than the ≥140/90 cutoff familiar in many other contexts, which is why the 61.4% overall prevalence headline looks scary. This is a choice of threshold, not data manipulation.
Five — competing interests.Several authors have Withings research funding or advisory roles (P.E. is a Withings consultant). The paper states Withings played no role in any part of the study — the conclusions themselves are not influenced by the funder, but readers should know it exists.
Six — “irregularity = disease” is rhetorical.The paper’s wording is “chronic sleep problem,” not a clinical diagnosis. The title’s framing of “weekend catch-up as disease?” is a question, not the paper’s conclusion.
One sentence to close.
8. Three Things to Carry Away
First, sleep regularity is an independent health indicator in its own right.A 90-minute duration SD plus 60-minute midpoint SD is a hard self-check threshold — you can run it yourself on your wearable data. The threshold is not arbitrary; past it, hypertension and cardiovascular risk rise measurably.
Second, irregularity is stubbornly sticky once it sets in — but so is regularity.After 6 consecutive irregular months, the probability of staying irregular next month is >80%; after 4 consecutive regular months, the probability of staying regular exceeds 90%. Bad habits and good habits both have inertia — but installing a good one works better than it feels.
Third, this is observational: association is not causation, and the 6-month window is an intervention opportunity, not a treatment promise.Chronic irregularity goes with higher BP, but the paper does not say irregularity causes higher BP. The 6-month window marks the boundary between “behavior is reversible” and “the pattern has chronicized”; past it, the paper does not promise reversal.
Paper DOI: 10.1111/jsr.70430, OA (CC BY), Journal of Sleep Research 2026.
Reference links
- DOI: https://doi.org/10.1111/jsr.70430
- Flinders University sleep health research group (corresponding author: Hannah Scott)