
Your performance is fine and your numbers hold up. The internal opening you want is posted, and you have already rewritten your resume — then you save it back to drafts. Not because you are afraid to apply, but because you do not want your direct manager to know you did.
That is not a scenario I invented. One worker, quoted verbatim in the paper’s appendix survey, wrote that a former boss badmouthed them to prospective new superiors behind their back in order to keep them on the team. Another described the signal received in a career talk: do not plan on moving teams within three years of joining.
Before I read this paper, one question sat underneath everything:why is changing jobs inside the same company something you have to hide from your boss?After reading it, the answer is more institutional than I expected, and more calming — the problem is probably not you, it is your manager’s scorecard.
The conclusion up front:three out of four managers self-report holding on to employees who should have been promoted or moved(note the wording: the 75% is what managers self-report in an anonymous survey; it is not a measured rate of “three out of four managers were caught hoarding”). And the people being held are, on average, the stronger ones: if they actually applied, they would be hired close to half the time, against a firm-wide average under three in ten.
What follows walks through eight steps: where the data come from, what the scorecard leaves out, why managers cannot afford to let people go, an accidental natural experiment, whether the blocked applications would have landed, who gets blocked hardest, the doubts I kept after reading, and what you can do. Every number has been checked against the paper.
1. I used to think I was not good enough
Why do I care? I have watched strong colleagues sit in one role for three or four years, hearing “next time” at every internal hiring round. I have also seen the other pattern: the moment someone says out loud that they are applying internally, interesting projects and training quietly stop arriving. Workers wrote that pattern down in the paper verbatim — those colleagues received no further training and no more interesting projects, and the supervisor had written them off.
We normally tell these as individual stories: a bad boss, bad luck, a toxic culture. The value of this paper is that it takes firm-level data and turns the individual story into a general pattern.
Three background numbers on how common it is:
- Seventy-five percent (75%)of managers self-report this behavior in an anonymous survey — keeping employees on their team who should move on (paper abstract and Table 3, self-reported wording).
- 83%of Germany’s top publicly listed companies cite managers holding talent back as a crucial internal friction (a survey the paper cites from hkp, 2021).
- Scientists are not exempt either: the paper’s footnote quotes an account of a later Nobel-laureate mRNA researcher whose advisor vowed to stop her from leaving and told her she had two choices — work in his lab or go home (Zuckerman, 2021, via footnote 1 of the paper).
Put those three together and my old explanation stops working: if this were only about bad bosses, it would not show up in three out of four managers. The better reading is thatthe system rewards managers for gripping their people.
So where does the evidence come from? Look at the data.
2. The data come from four years inside one company
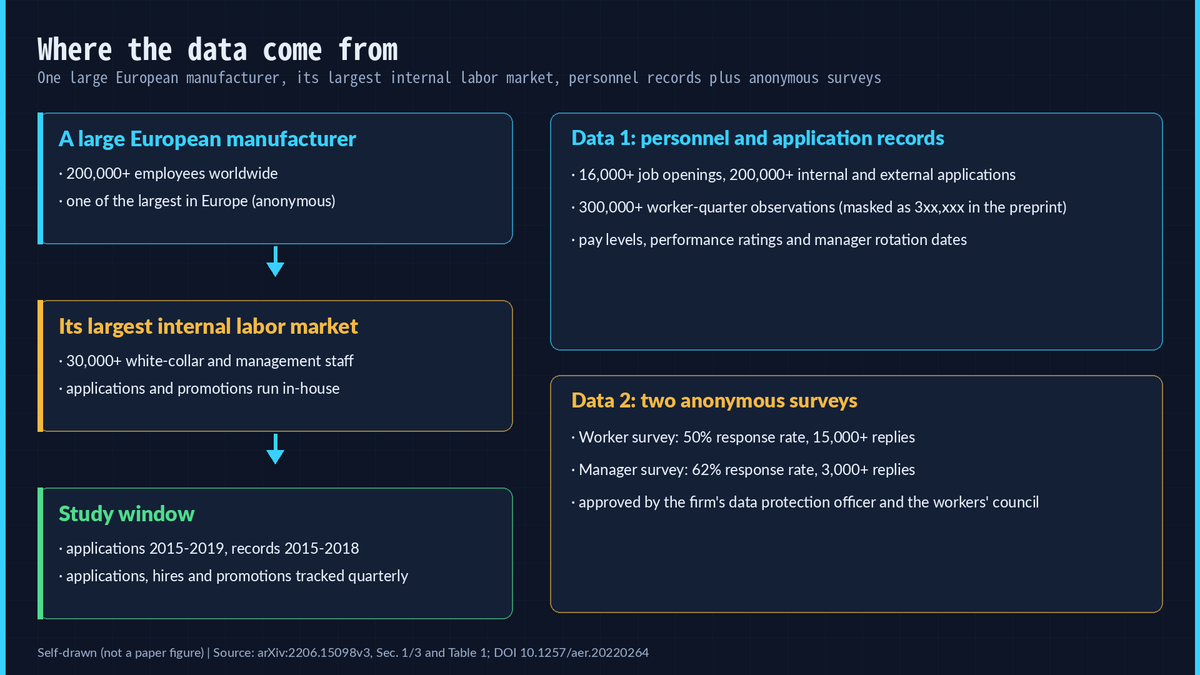
There is no randomized control trial here, and the surveys were not sprayed at a random set of firms — what the paper gets its hands on is the internal records of one real company. The firm is one of the largest manufacturers in Europe, with over 200,000 employees worldwide. The analysis focuses on its largest internal labor market: more than 30,000 white-collar and management employees in Germany.
Two streams of data:
- Personnel and application records: application data cover 2015 to 2019, including over 16,000 job openings and over 200,000 internal and external applications; personnel records cover 2015 to 2018, with more than 300,000 worker-quarter observations. One honest caveat:the preprint masks the exact observation count as
3xx,xxx(the published version may carry the full number, but we do not have its text for this episode), so this article reports ranges rather than false precision. - Two anonymous surveys: the worker survey returned a 50% response rate with over 15,000 replies; the manager survey returned 62% with over 3,000 replies. Both were approved by the firm’s data protection officer and the workers’ council, and because of German data protection rules the survey answers cannot be matched person by person to personnel records — the paper states this itself, and I will not paper over it.
The strength of this combination:what managers and workers say and what actually happened to applications, hires and promotions come from the same firm and the same years, so they can check each other. The weakness is equally obvious: one company, one country, one industry. Section eight comes back to that bill.
Data seen — but hold off on conclusions. What do the managers themselves say? Their answers point at one very specific place: the scorecard.
3. The scorecard has no line for letting people go
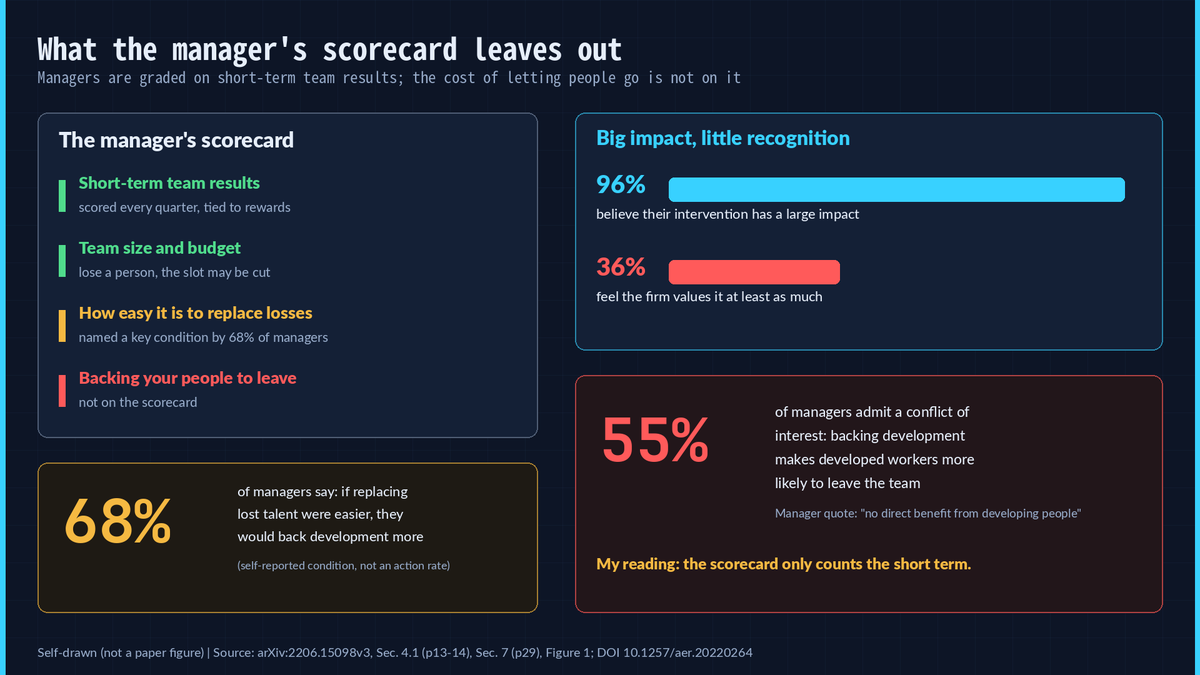
The paper asked managers a battery of survey questions. Four numbers matter when you put them side by side:
- 55%of managers agree or strongly agree that “supporting employee career development entails a conflict of interest, because more developed employees are more likely to leave the team” — more than half admit the conflict exists.
- 96%of managers believe their intervention has a large impact on their employees’ careers, but only36%believe the firm values that impact at least as much as their impact on the immediate team. Asked a different way, the split is similar: 87% say talent development is an area where they create high impact, while only 40% say a record of developing people matters for their own compensation and promotion.
- 68%of managers say they would be more likely to support career development if replacing lost talent were easier. This 68% is a self-reported condition for easing up,not “68% of managers were observed holding people back”— do not mix the two.
My reading: managers do not deny that developing people matters — 96% believe they can shape their employees’ careers. The problem is that the scorecard only books entries on the other side: short-term team results are scored every quarter and tied to rewards, while “the cost my team eats when a good employee leaves” has no line to catch it. Between 96% who feel impact and 36% who feel recognized sits a 60-percentage-point gap — the open ground where effort goes unrecorded.
So why do managers not compensate some other way? Because the levers they have all push in the same direction: keep them.
4. Managers are not villains: they are placed in a position where they must hoard
Two manager quotes first, both from the paper’s appendix survey:
“Managers have no interest in developing talents because they have no direct benefit from it.”
“Positions are cut if an employee takes on a new job or even dies, so managers are afraid that their team will shrink.”
The second sounds absurd, but its logic is plain: a person leaves, the headcount may disappear, the team shrinks, and resources and influence shrink with it. Under those constraints, keeping capable people is the individually rational response for a manager — even when it hurts the firm.
The paper then quantifies “when do managers grip harder” with regressions, and all three coefficients run in the predicted direction (Table 2, OLS, survey-based hoarding measure):
- Each1 percentage point higher share of performance-related payis associated with0.1892higher hoarding (p=0.003). The more pay tracks team performance, the harder it is to let go.
- Each additional direct reportlowers hoarding by0.0133(p=0.000); between the 90th and 10th percentiles of team size the difference is0.1308. Bigger team, smaller marginal loss per departure.
- Managers inlow-visibility functions(areas top management watches less) hoard0.0397more (p=0.013). The less visible you are, the less anyone checks.
Together these three give me a different judgment from the one I started with:holding people is not a character flaw, it is the downstream of incentives. A firm that asks managers to develop talent, pays them on short-term team performance, and tolerates “leave and your headcount is cut” gets exactly one equilibrium — grip tighter.
Everything so far, though, is still what managers say, and what correlates with what. Surveys cannot tell you who blocked whom. To answer what the blocked applications actually cost, the paper needs an external shock — and the firm has one built in.
5. An accidental natural experiment: the moment the gatekeeper leaves
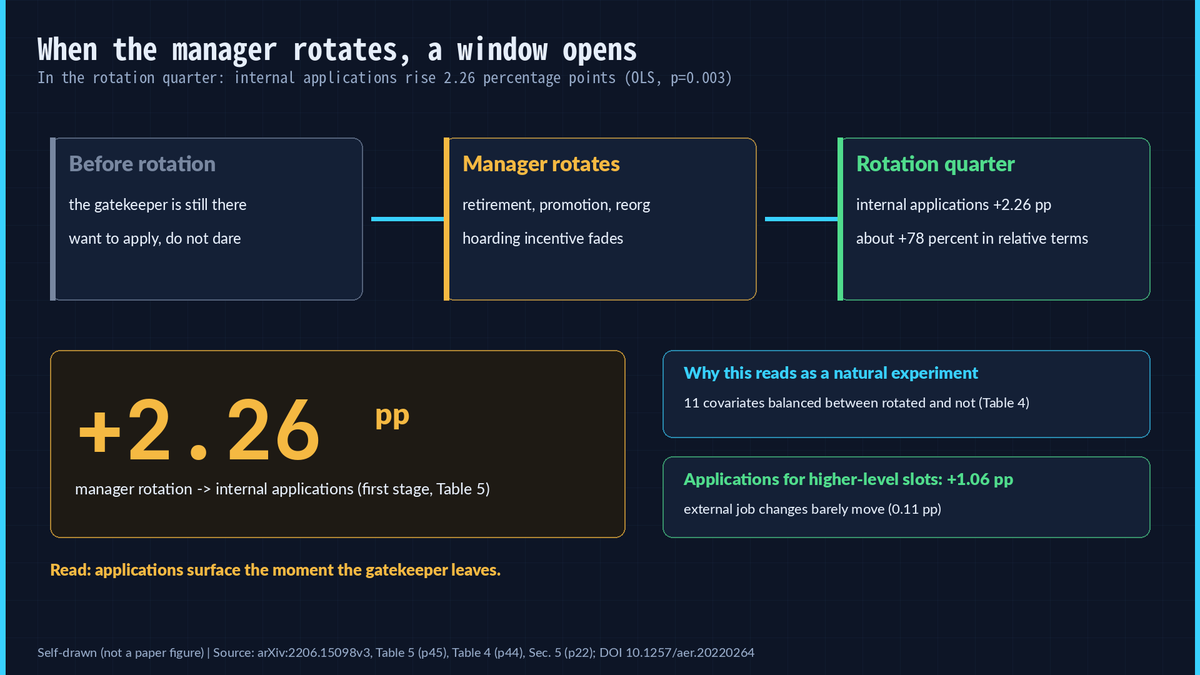
In this company managers rotate out for retirement, promotion, or reorganization. When the manager leaves, the new manager has not built up a talent stockpile yet, so the old incentive to hold fades — a brief window opens for the people who were being pinned down.
The paper grabs that window. The headline number:in the quarter of a manager rotation, employees’ internal applications rise by 2.26 percentage points(Table 5 first stage, coefficient 0.0226, standard error 0.003, p=0.003; the paper’s prose rounds this to “about 2.3 percentage points”), which is roughly a78%increase in applications in relative terms (paper, Section 1). Applications for higher-level positions rise1.06 percentage points(Table 5 Panel B, 0.0106).
Why can this be read as a natural experiment? Because workers do not get to schedule rotations. The paper runs a balance check: rotated and non-rotated groups are statistically indistinguishable on11 variablesincluding age, education, performance ratings and team size (Table 4 Panel A), which supports the reading that rotations are close to random. Placebo and exclusion tests are also reported (Tables B8 and E2 in the appendix).
Let me state the evidence boundary precisely:this is quasi-random identification rather than a randomized controlled trial. A rotation could still coincide with some unobserved team shock; the paper rules out what it can and leaves the rest open. The careful reading is this: the jump in applications is locked in time with the gatekeeper’s exit, and its direction and size match the holding story — the closest thing to causality we have, but it still rests on a set of econometric assumptions.
The window opened, and the pinned-down people moved. Did they have a shot? That is the most painful section in the paper.
6. The blocked applications: half of them would have landed
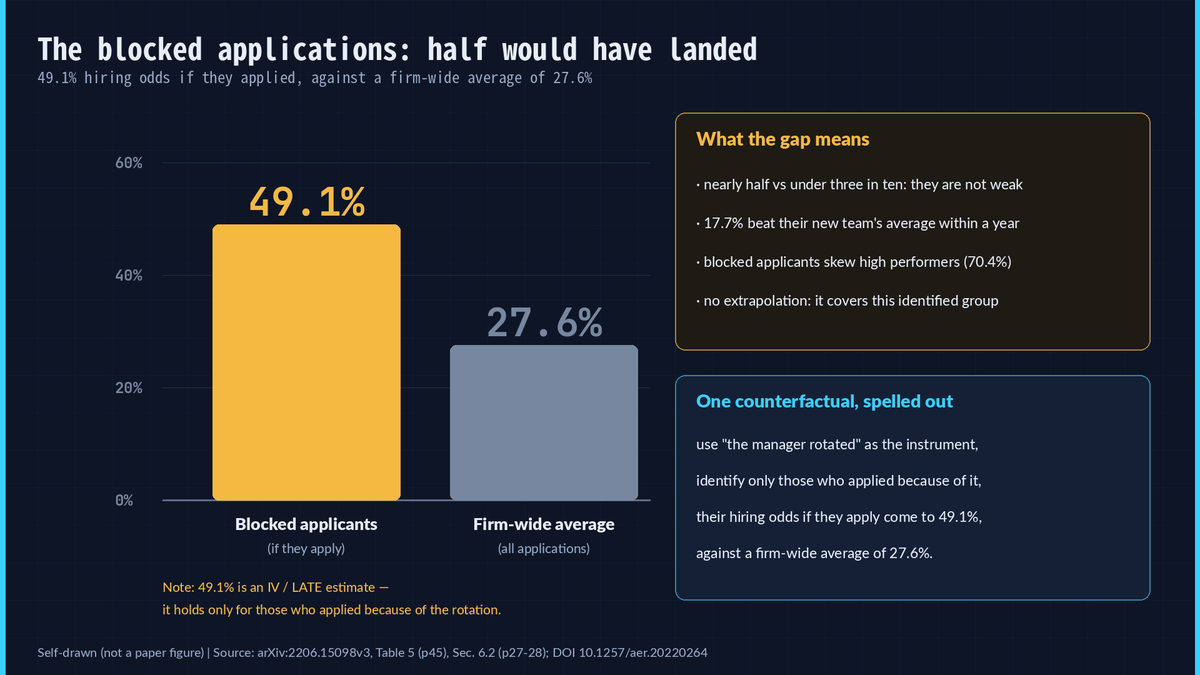
Using the manager rotation as an instrument, the paper isolates a group:people who only apply once their manager has rotated. These are the workers held back by the incentive to keep them, who act the moment the window opens. If they apply, their probability of being hired is49.1%(Table 5, 2SLS estimate 0.4913).
The comparison is the firm-wide average hiring probability of27.6%.
| Who | Hiring probability | Source |
|---|---|---|
| Blocked applicants who only apply after rotation | 49.1% | Table 5 Panel A (IV/LATE) |
| Firm-wide average | 27.6% | paper, Section 6.2 |
| Hired after rotation, outperforming the new team’s average after one year | 17.7% | Table 5 Panel A Column 3 |
| Of those, hired into higher-level roles and outperforming | 20.1% | Table 5 Panel B Column 3 |
Nearly half against under three in ten — the meaning is direct:the people pinned down by the incentive to hoard are not unwanted employees, they are employees who would very likely have moved. The complier analysis points the same way: 70.4% of these marginal applicants are high performers, and 61.2% of marginal female applicants hold a graduate degree (Table 7). The people managers keep are precisely the people who could be picked.
Now pin the wording down so I do not oversell the paper:49.1% is an IV/LATE estimate and holds only for the group “people who applied because the manager rotated”— it does not generalize to “every hoarded employee would face 49.1%”. The same caution applies to 17.7% and 20.1%, which rest on identification assumptions such as monotonicity (the paper tests it in Table B9, but an assumption is still an assumption).
One question remains: within this group, who gets blocked hardest?
7. The hardest blocked are the ones who dare not speak up
Split the marginal applicants by gender and the gap appears immediately (Table 6):male marginal applicants are hired at 41.2%, female marginal applicants at 62.3%. Women are blocked more deeply, and when they do apply they succeed more often.
The paper’s counterfactual estimate (Section 6.3, based on the potential-outcome comparison in Figure 7 — summarized here in words, no figure reproduced): if the women being held back could apply freely, their earnings gains would exceed men’s,shrinking the gender pay gap by 86%.
On the other side is the backlash. The paper’s conclusion reports that workers who say they are subject to hoarding are30% more likely to report having searched for external jobs. Add the contrast that a manager rotation raises internal job transitions by 1.1 percentage points while barely moving external ones (0.11 percentage points, appendix Table B5), and the picture completes:the incentive to hold blocks internal doors, and external doors never wait. The firm wastes its development investment and hands the person to a competitor, and the person the manager wanted to keep leaves anyway.
That is the paper’s case. Whether to trust it depends on its edges — the next section is the cold water I pour on myself.
8. Three doubts I kept after reading
First restate the claim, then criticize it: the paper shows that hoarding incentives are widespread, that hoarding actions rise with stronger incentives, and that exposure to hoarding — timed by manager rotations — suppresses internal applications and reshapes talent allocation. What it does not show, in three points:
1.Who does one company represent?The sample is German white-collar staff at one large European manufacturer. Its internal application process and manager evaluation practices are firm-specific. Small firms, the tech industry, other labor-law environments may show very different magnitudes. This is an external-validity boundary, and the paper itself keeps its conclusion inside this firm. 2.“Self-report” and “the causal chain” each have a soft spot.The 75% comes from an anonymous self-report survey — the paper protects anonymity, and the author even argues social desirability bias would push the numberdown, but survey framing effects could run the other way and nobody can guarantee their size. Because of German data protection, survey responses cannot be linked to personnel records person by person. The rotation design passes balance tests on 11 observables, yet unobserved concurrent shocks cannot be fully ruled out. Estimates like 49.1% depend on the monotonicity assumption of the LATE framework and hold only for the identified group. 3.The efficiency loss is an inference the paper never measured.The paper measures blocked applications, the success those applications would have had, and stronger job search — butit never directly measures a decline in organizational output or productivity. “Hoarding costs the firm productivity” is a reasonable inference; the paper never produced it as a number, and I keep that line whenever I cite it.
Two more facts you should know when reading the original:
- Version note: this article is based on arXiv:2206.15098v3 (2025-07-21, a 111-page preprint). The published version is American Economic Review 116(8): 3110-3151 (August 2026), DOI 10.1257/aer.20220264, behind a paywall. The preprint carries no statement of differences from the published version, observation counts are masked in the preprint (
3xx,xxx), and any full numbers in the published version should take precedence. - Conflict-of-interest disclosure (from the paper’s footnote, reproduced as written, must not be dropped): the work was supported by the Alfred P. Sloan Foundation Pre-doctoral Fellowship on the Economics of an Aging Workforce awarded through the NBER, an IRLE Student Research Grant, an O-LAB Labor Science Initiative Grant, a Strandberg Grant for Gender in Economic Research, a UC Berkeley Matrix Dissertation Fellowship, and a Washington Center for Equitable Growth Doctoral Grant; the author thanks her institutional partner (the sample firm) for feedback and support. Readers should weigh this funding and relationship when reading the conclusions.
Cold water poured. Back to you: what does this paper mean for an individual contributor and for someone running a team?
9. What you could do tomorrow
State the boundary first:the following three items are practices drawn from the paper’s results; the paper itself does not conclude them— the paper offers mechanisms and a policy direction; it hands out no personal advice.
Two for individual employees:
1.The act of applying is itself a bargaining chip.In the paper, blocked applications surge the moment the window opens, and that group is above average in quality and in success rates. Treating “applying internally” as forbidden is exactly what the incentive to hold trains you to do; on average you would fare better than you fear (the firm-wide average hire rate is 27.6%, and this group sits at 49.1%). 2.Whether to hide the application hinges on the environment rather than on nerve.The quoted accounts show retaliatory reactions are real — no more training, no more good projects. Whether to apply openly depends on your read of your direct manager, a situation the paper never measured; that judgment is yours.
One for team leads and for the people who design the rules, taken from the most constructive part of the paper’s conclusion:68% of managers name the ease of replacing lost talent as a key conditionfor supporting development — holding people is not human nature, it can be redesigned away. The paper points to directions such as keeping headcount and budget when someone moves, protecting applicants from retaliation through confidentiality, and having a third party like HR invite workers to apply directly. These are policy directions stated in the paper’s conclusion (recommendations whose effects remain unverified).
Back to the opening question: to change roles, should you hide it from your boss? The paper does not answer that for you; it answers a harder question instead —the reason you are not moving up is very likely not that you are not good enough. Three in four managers admit they hold people, the held group would have landed close to half the time, and women are blocked hardest yet succeed more once they apply. Keep those numbers, and the next time you save your resume back to drafts you will not start by blaming yourself.
If you remember one line, take this:the capable are the ones who get held — that is not a compliment, it is why you are stuck.
Source and version: Talent Hoarding in Organizations by Ingrid Haegele. Published version: American Economic Review 116(8): 3110-3151, August 2026, DOI 10.1257/aer.20220264 (paywall); analysis in this article follows the preprint arXiv:2206.15098v3 (2025-07-21). Every percentage, coefficient and page reference was checked line by line against the preprint text. The preprint contains no statement of differences from the published version, and observation counts are masked as 3xx,xxx.
Figures: fig01-fig04 are drawn by this article (structural diagrams and data redraws using values reported in the paper’s text, with the source table or figure named). Under the applicable licenses (arXiv non-exclusive distribution license plus AER copyright retained), this articlecontains no reproduced figures from the paper.