Paper: Chen, Lind, Ram & Odgers, Adolescents’ Daily Affect Predicts Their Mobile Phone Use (Not the Other Way Around), psyArXiv preprint DOI
10.31234/osf.io/5d67p, accepted for publication in the Journal of Research on Adolescence. This article does not pronounce the final answer for the authors. It just walks through forty teenagers’ ninety days of objective data and asks what the diary actually says, what it does not say, and where the question marks belong.
I. The phone: which hand moved first
It is hard to find a debate older than “should teenagers be allowed to use their phones.” Social-media age limits. School phone bans. Parents’ group chats forwarding “three hours of daily scrolling causes depression” every other week. Almost every policy and piece of pop-psychology assumes the same thing: the phone is the source that wrecks young people’s mood and sleep.
But science is not that confident. Across the past decade, studies on phone use and adolescent affect or sleep have found effects that are tiny, inconsistent across studies, and highly sensitive to the methodology used — cross-sectional designs, self-reported recall, mismatched questionnaires. What they give you is “the two correlate a little,” never “the phone came first” or “the mood came first.”
That is exactly the old question this paper tries to answer. It flips the approach — no recall, just daily, objective, passively logged data. It uses the keystroke timestamps and foreground app time that the Android operating system exposes to separate “moving the fingers” from “moving the eyes.” It then captures the same person’s day-to-day fluctuation with a three-item morning survey, every morning, for ninety days.
What it ends up with is forty teenagers tracked for ninety days, yielding 3,192 daily diary entries. In what follows, we follow that diary to find the answer.
II. Why the older research kept getting stuck
It is not that nobody studied this. It is that the methods themselves took the answer off the table. Two paths dominated.
The first was a one-off survey. Gather a group of teens, ask them “about how many hours a day do you use your phone,” ask their mood, run a correlation. The problem is that a snapshot taken at one moment in time cannot tell you which side came first. Heavy-phone-using teens may be more depressed — or depressed teens may use their phones more. The snapshot does not know.
The second path asked teens to recall “about how many hours a day” — which is too noisy to trust. Try recalling how many hours you used your phone last Wednesday. You probably cannot.
Both paths dead-ended the directionality question. The paper’s opening sentence says it plainly: the scientific evidence … remains deeply contested. So any claim that “phones are ruining the kids” is, at heart, a directionless guess.
This paper’s solution: abandon recall, let the phone speak for itself — but without resorting to large-scale psychological snapshots.
III. Forty teenagers, ninety days, EARS: how the study was wired
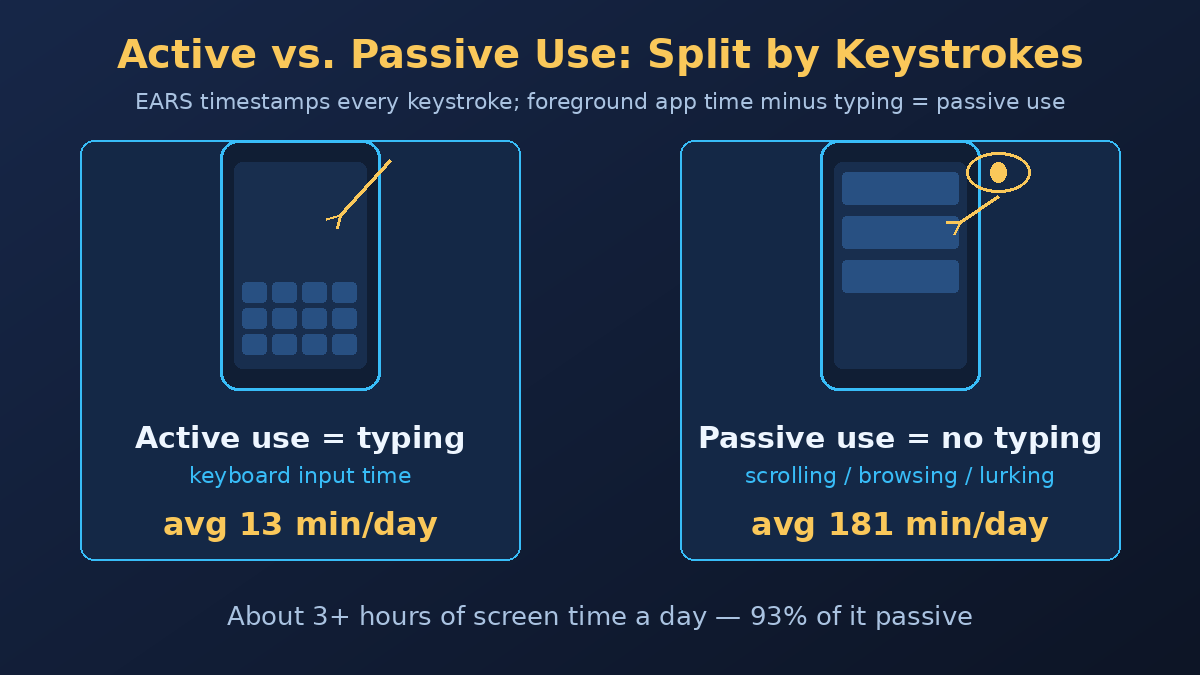
The forty teenagers were aged 15–20 (M = 17.4, SD = 1.35), 26 male and 14 female. Twenty-five met the marker for economic disadvantage (self-reported qualification for free or reduced-price lunch). The data window ran from August 2020 to February 2021 — the COVID period, with remote or hybrid schooling. These numbers need to stay in mind, because they are the very reason the conclusion is not something to be scaled up to everyone.
Each participant installed a research app on their phone calledEARS (the Effortless Assessment Research System), developed by Ksana Health, which passively logs app use and keystrokes. It sat quietly in the background for ninety days:
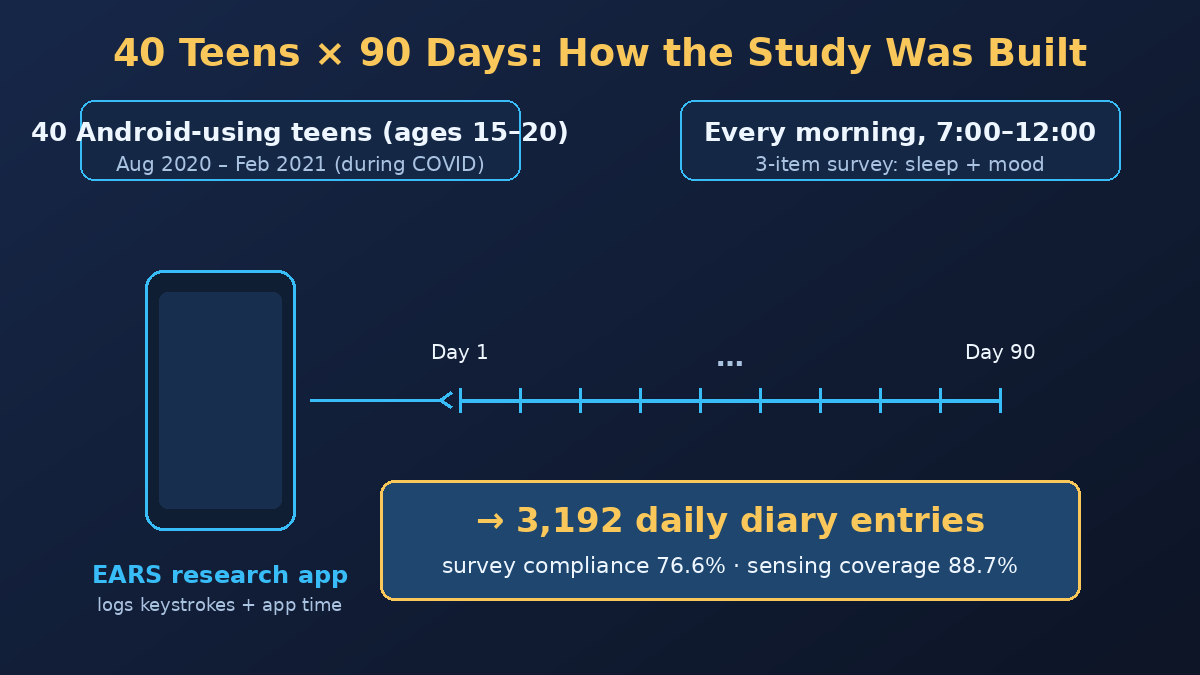
- Keystrokes: every key press is timestamped, except those made in secure fields like passwords or payment forms. These intervals, summed up across the day, give the “typing” time.
- Foreground app duration: total time an app was in the foreground, minus the typing time — that is the “screen on, but not typing” time.
The study sliced phone use into two categories:
- Active use= time spent typing;
- Passive use= time the screen was on but no keys were being tapped (scrolling, browsing, lurking).
This operationalization is imperfect — the authors admit as much in the discussion. It is relatively crude and does not separate content type, platform, or social quality. But it is already much sharper than “how long did you use your phone today,” because most of the time our eyes and our fingers are doing very different things on the same device.
Each morning between 7:00 a.m. and 12:00 p.m., the phone pushed a three-item mini-survey: how well did you sleep, how are you feeling this morning. The affect items were sampled at random each day — one positive (feeling good / optimistic / respected) and one negative (sad / anxious / worried) — on a 1–5 scale.
Compliance: participants completed an average of 69 out of 90 possible daily surveys (76.6% compliance), with passive-sensing data available for an average of 79.8 out of 90 days (88.7% coverage). Keep this number in mind — it is the foundation for whether the conclusions can be broadened to everyone.
Why only Android? iOS, by design, does not grant third-party research apps access to keystroke or detailed foreground-app data. The analytic sample was therefore trimmed from 126 teens with full data to 40 Android users.
The analysis used multilevel models (lme4 in R). The focus was onwithin-personcomparison: the same individual, today versus their own baseline. Each participant was person-mean-centered — every day’s score became “today versus your usual.” This design is exactly what answers “does a fluctuation in mood make me scroll more,” rather than “are heavy-scrolling teens more depressed.”
IV. The baseline: three hours on screen, only 13 minutes of typing
Start with the descriptive picture — the summary of all 3,192 days:
| Dimension | Daily mean | Range | ICC |
|---|---|---|---|
| Total use | 194.4 min (≈3 h 14 min) | 0–989 min (≈0–16.5 h) | .45 |
| Passive use | 181.0 min | 0–979 min | .44 |
| Active use | 13.4 min | 0–290 min | .24 |
The ICC, translated into plain English, says:what fraction of the variance sits inside the same person across days (within-person), versus across different people (between-person). An ICC of .45 means 45% of the differences in total daily phone use come from person-to-person variation; the remaining 55% comes from day-to-day variation within the same person.
In other words,within-person daily fluctuation beats between-person differences. The gap between the same kid today and yesterday is larger than the gap between that kid and another teen they have never met.
So the average “teenager uses their phone for X hours a day” is a half-truth at best — it explains barely half the variance. The other half lives inside each teen’s own day.
The most striking contrast in the table is the 13 vs 181 split. On average, these teenagers had their phone screen on for 194 minutes per day — butonly 13 of those minutes were spent typing, and the other 181 minutes were scrolling.
In plain language: you think your kid is using their phone, but most of the time your kid is just using their eyes.
So the next question is no longer “how many hours did you use the phone today.” The next question is what is driving those hundred-plus minutes of mindless scrolling.
V. The only finding that actually showed up: a bad morning, about 8 extra minutes of scrolling
The researchers compared each teen to themselves: this morning’s mood, against today’s scrolling. Same kid, today versus their own baseline.
Three pairings were tested:
- Morning negative affect → same-day passive use
- Morning positive affect → same-day passive use
- Morning affect → same-day active (typing) use
Theonly significant main effect in the entire paperappears in the first pairing:
Each 1-point increase in morning negative affect is associated with about7.6 extra minutesof same-day passive use (b = 7.642, 95% CI [2.988, 12.296], p = .001).
The confidence interval looks abstract — translated: if this study were repeated, 95% of the time the true effect of morning negative affect on that day’s scrolling would land somewhere between about 3 and 12.3 minutes. The whole interval sits above zero and does not cross it — that is where “significant” comes from. A p-value of .001 means the probability of seeing this pattern by chance, if there were no real effect, is less than one in a thousand.
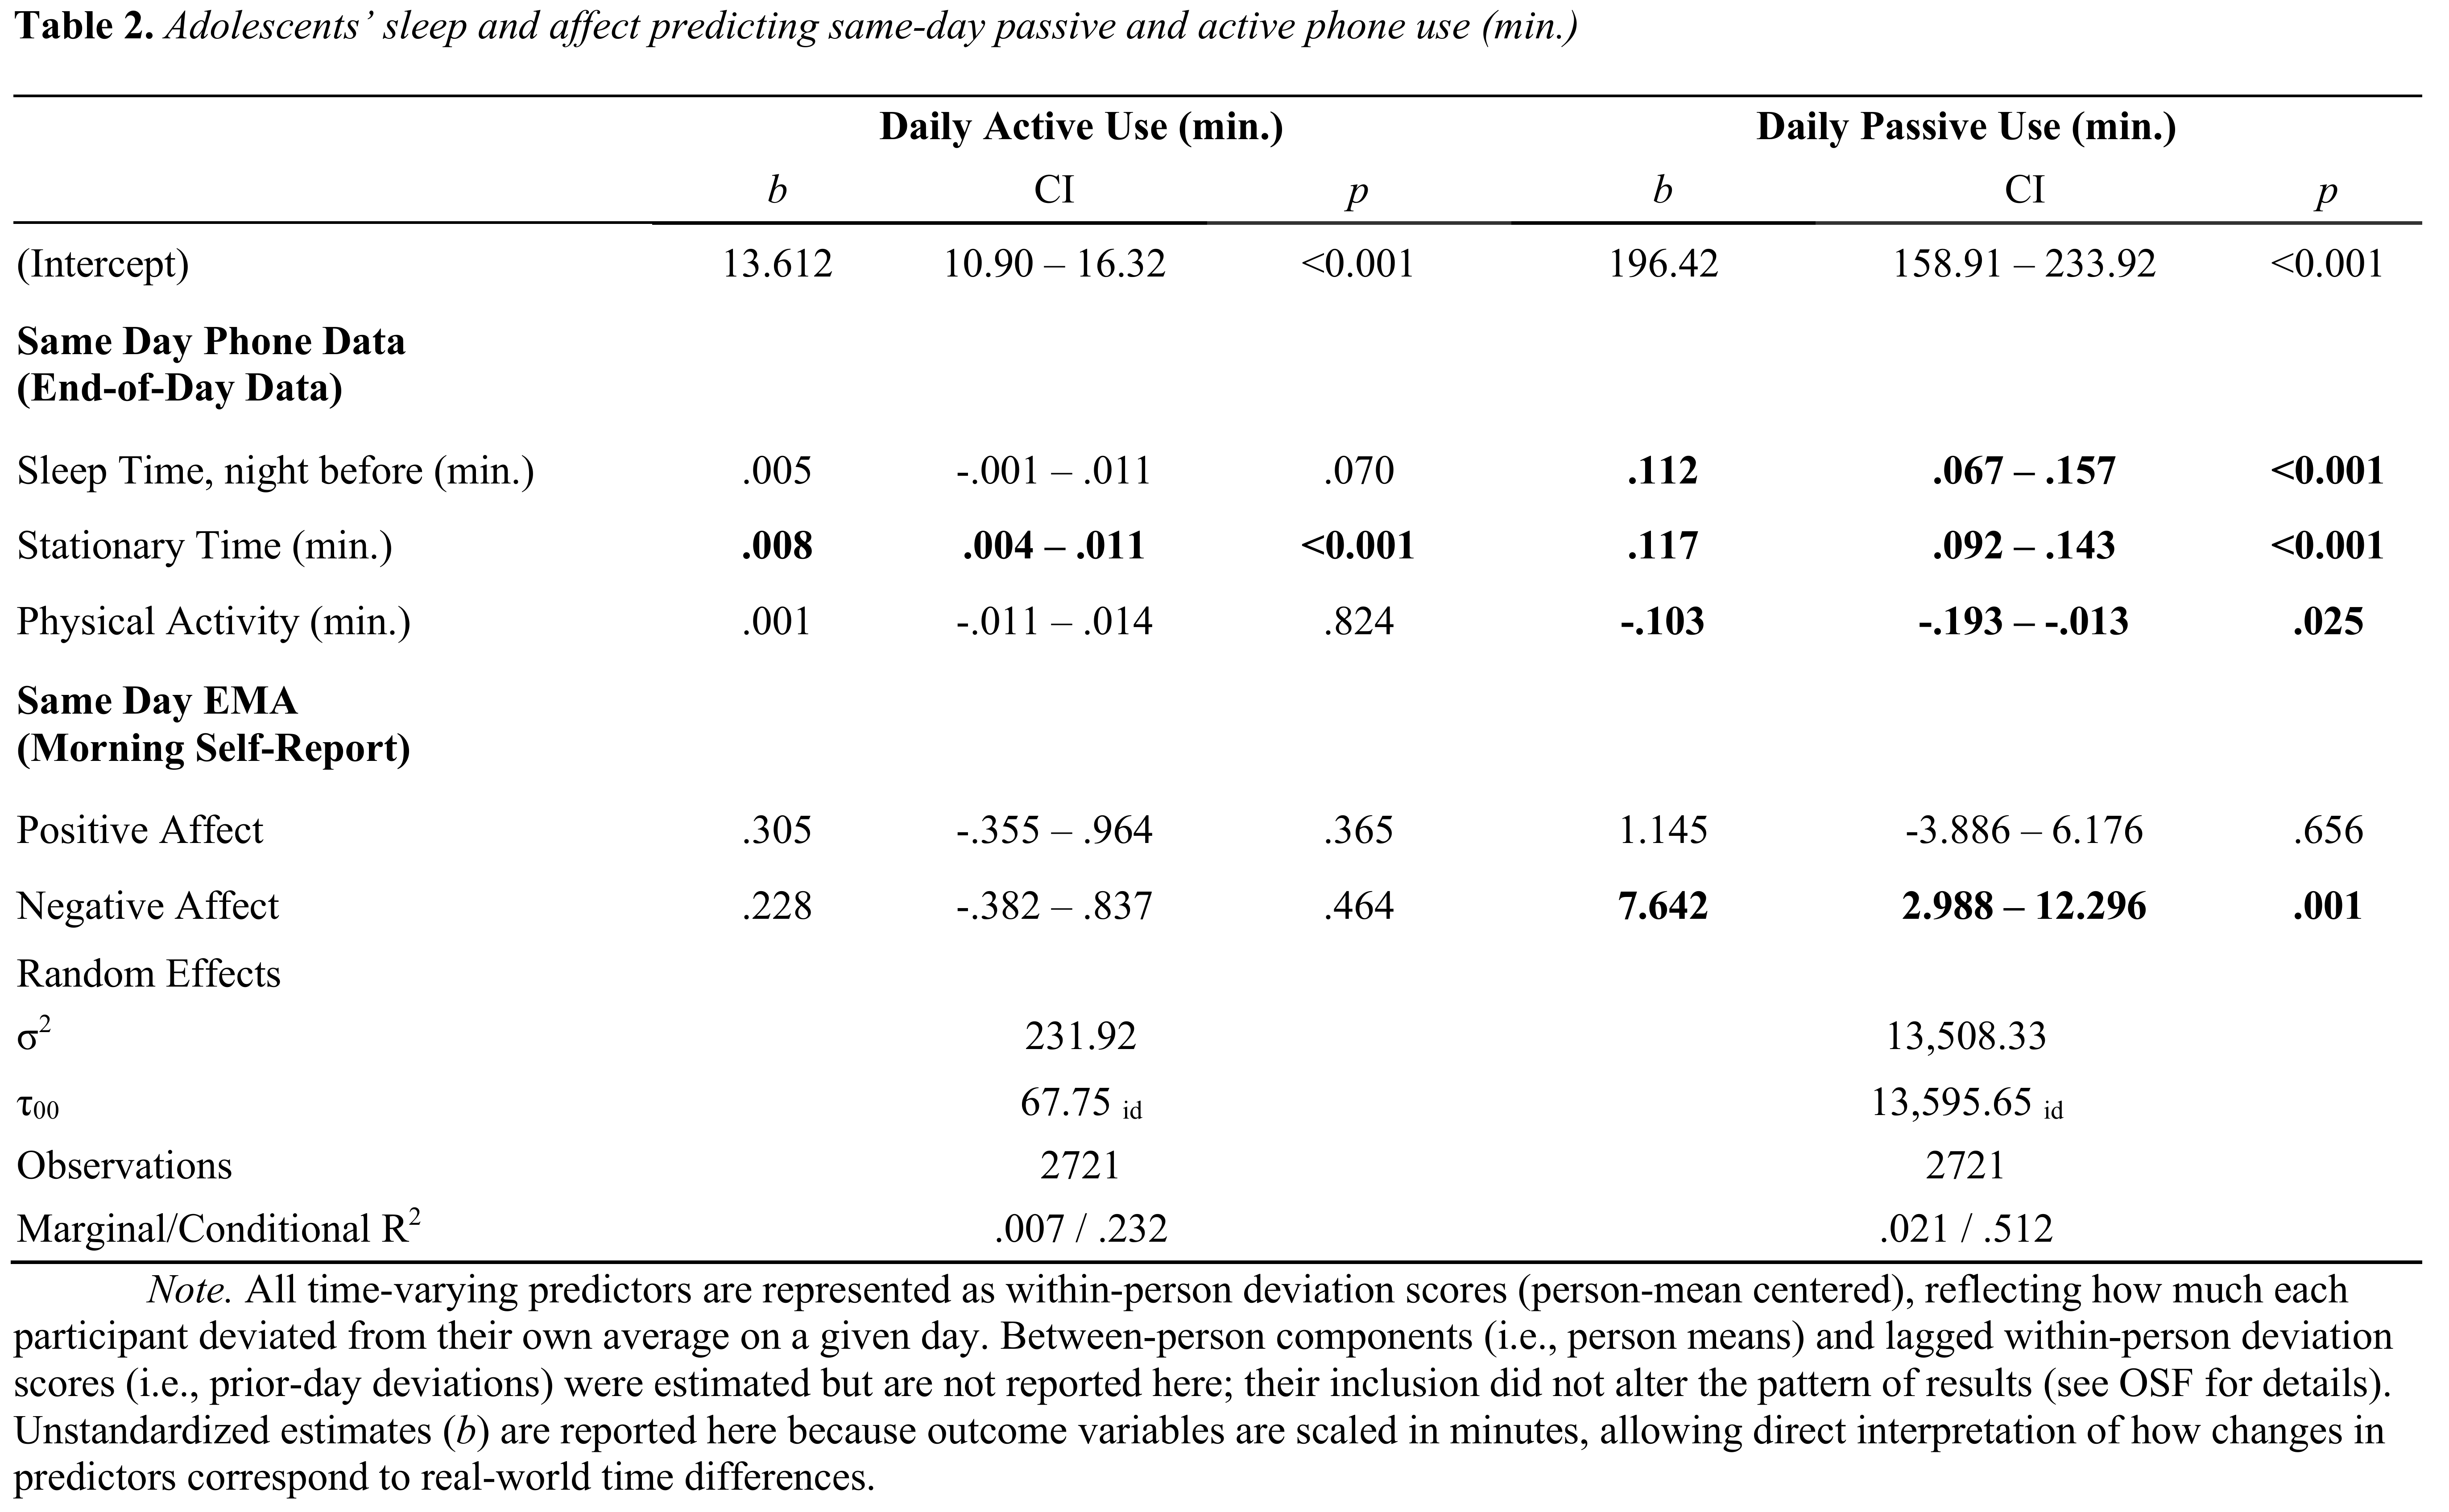
The other three pairings did not reach significance: a good mood did not lead to more scrolling (b = 1.145, CI [-3.886, 6.176], p = .656), and mood had no significant effect on typing time either — neither negative affect (b = .228, p = .464) nor positive affect (b = .305, p = .365).
This is the single most important number in the paper — and the place where the default social script has to give way:on days when the morning mood was worse, the teen did scroll more, but only by about 8 minutes, and only the passive portion — typing time did not move.
Two covariate details worth keeping: longer prior-night sleep was associated with more same-day passive use (b = .112, p < .001); more stationary time was associated with both more active and more passive use; and more physical activity was associated with less passive use (b = -.103, p = .025). All of these are consistent with the same underlying story — mood is the entry point for passive scrolling, but the surrounding behavior (sleep, movement, stillness) also shapes it.
VI. The reverse direction: a string of zeros
What about the reverse? Can daytime scrolling predict that night’s sleep, or the next morning’s mood? The researchers tested RQ2 and RQ3 across the board — and the result isRQ2 all null, RQ3 all null.
RQ2 (same-day use → next-morning affect):
| Path | β | p |
|---|---|---|
| Active use → next-day positive affect | -.004 | .804 |
| Passive use → next-day positive affect | -.024 | .171 |
| Active use → next-day negative affect | -.005 | .780 |
| Passive use → next-day negative affect | .014 | .431 |
RQ3 (same-day use → that-night sleep):
| Path | β | p |
|---|---|---|
| Active use → that-night sleep quality | .007 | .640 |
| Passive use → that-night sleep quality | .020 | .208 |
| Active use → that-night sleep duration | -.033 | .087 |
| Passive use → that-night sleep duration | -.035 | .071 |
All of these p-values sit comfortably above the conventional .05 threshold — most are not even close to .10. Translated:this dataset could not detect a “more scrolling during the day → worse sleep that night” or “more scrolling → worse mood next morning” chain.Both the active-typing and the passive-scrolling paths come up empty.
The only significant finding is “more daytime sedentary time → less sleep that night and worse sleep quality” (β = -.049, p = .011 and .002). That is a behavioral-context effect, not a phone effect.
Notice the difference between “could not detect” and “does not exist.” RQ2 and RQ3 are null, not negatively significant. They meanthere is no evidence for a “phone → affect / sleep” reverse causal chain in this data, but they donot assert that no such effect can ever exist. The takeaway is that this dataset shows no stable link, not that the link is impossible.
The whole picture is a one-way street: mood → passive scrolling, direction is clear, magnitude is small; scrolling → mood or sleep, the reverse direction could not be measured.
VII. How to read it: the low-cost exit hatch of mood management
The authors’ explanation is calledmood management.
When you feel bad, you do not pick the high-cost option — call a friend, go for a run, confront whatever made you feel bad. Scrolling the phone takes no thinking, no face-to-face contact; it is the cheapest exit you can reach with one hand. It will not actually resolve the bad feeling, but it can move it to the back of the room for a few minutes.
So it is not that the phone is so fun. It is that the phone is the easiest thing to grab when you feel bad. This also explains the universal gut feeling that “scrolling feels right when I am in a bad mood” — that is not a personal weakness, it is your brain picking the path of least resistance.
There is also an interpretive layer worth keeping:all these comparisons are “you vs yesterday,” not “you vs another kid.“The finding says “I scroll more when I feel bad,” not “kids who scroll a lot are more depressed.” Headlines blur these two on purpose.
- Thewithin-personquestion (the same kid today vs their baseline) is what this paper actually measures.
- Thebetween-personquestion (one teen vs another) is what this dataset cannot answer — with only 40 people, you cannot robustly test whether age, gender, or socioeconomic status moderates the pattern.
That distinction is academic in tone but very practical in use. Next time you see a headline claiming “scrolling X hours a day causes depression,” ask: is it measuring “I scroll more when I feel bad,” or “heavy-scrolling teens are more depressed”? The two questions require very different data and lead to very different robustness levels.
VIII. A critical reading: the conclusion and its boundary
The most useful thing to take from this paper is not the single number “a bad morning leads to 8 extra minutes of scrolling,” but the conclusion seen together with its boundary.
First, the sample is thin.Forty Android teenagers, average age 17.4, skewed male (26/40) and economically disadvantaged (25/40). They cannot represent all adolescents. The discussion itself notes that Android users in the parent study were more likely to be male and economically disadvantaged, which limits generalizability.
Second, the data were collected entirely during COVID.August 2020 to February 2021 — teens’ routines were already abnormal: remote or hybrid schooling, restricted social contact, amplified family friction. The paper lists this itself and makes no attempt to “clean out” the COVID effect; the authors admit they could not quantify school closures across the sample.Whether this “bad mood → more scrolling” pattern also holds under normal schooling conditions is a question this paper cannot answer.
Third, the active/passive split is rough.This distinction only looks at whether you typed; it does not separate content (chatting vs watching videos), platform (Xiaohongshu vs YouTube), or social quality (chatting with a close friend vs lurking among strangers). “Passive use” is a big bucket, and the content inside it may vary wildly.
Fourth, mood was measured only once a day, in the morning.The affect items were single questions on a 5-point scale, randomly drawn. Phone use’s feedback loops can be much faster than a once-a-morning catch — a distressing post at noon could shift mood by evening, and the next-morning catch is already a day late. The paper flags this as an explicit limitation and cites a larger-scale study to argue the gap probably does not matter much.
Fifth, the conflict of interest should be stated plainly.One of the authors, MNL, holds equity in Ksana Health, the company that holds the sole commercial license for EARS. That does not automatically invalidate the findings, but readers should know that the tool-builder is in the author list.
Sixth, convergence with a larger study.The paper points to Winbush et al. 2025, a study using roughly250,000 daysof objectively logged smartphone data, whose conclusion is consistent: the association between phone use and well-being is weak or null at both daily and longitudinal timescales. This paper is small in method and sample, but when it points in the same direction as a much larger study, the direction itself gains weight — even though either one alone stays modest.
Seventh, what the paper actually accomplishes methodologically.The real achievement is not “the conclusion is huge,” it is thatit measured directionality for the first time. Earlier research could only ask “are heavy-phone users more depressed.” This one can ask “when the same kid wakes up in a bad mood, do they scroll more that day.” It does not claim phones are harmless; it does not prove phones are blameless. It just nailed down a direction question that had been unresolved for ten years, in objective data, for the first time.
IX. What this means for a normal reader: a clue, not a one-size-fits-all answer
So what is the takeaway for the rest of us?
First, do not rush to blame the phone for your kid’s mood.Within the windows this paper measured (morning → same day, morning → next morning), the directional evidence runs the other way from the default script. It does not say “phones have no effect.” It just says that in the time windows it could see, the direction is reversed.
Second, ask how their morning went.The phone is more like a clue: a teen scrolling over there may be signaling that the morning did not go well. Swapping “why are you on your phone again” for “what happened this morning” is the most concrete thing this paper offers a parent.
Third, do not use this as a “phones are harmless” free pass.Forty teenagers, ninety days, COVID period, Android only, with the tool-developer among the authors — the boundary is sitting right there. There is no “groundbreaking” tone anywhere in the paper. It just puts a small, directional piece of evidence on the table, honestly.
Fourth, “could not detect” is not “does not exist.“RQ2 and RQ3 are null — meaning this dataset offers no support for a “scrolling → affect / sleep” chain, but it does not deny that finer-grained effects might exist. Readers should not read “we did not see it” as “it is not there.”
Fifth, methodological lessons worth keeping.Next time you read any “X causes Y” study, ask: is it a within-person comparison or a between-person comparison? Is it measuring “I feel worse today” or “this person is more like that person than I thought”? Is it cross-sectional, retrospective, or objectively sensed? The restrained conclusion of this paper comes precisely from doing the method carefully — and it is worth using as a yardstick for reading other phone-and-mood research.
One-line summary.Mood can drive phone use; phone use does not necessarily drive mood — this paper flipped the direction, using forty teenagers’ ninety days of objective diary. But the sample is only forty Android teens during COVID, so this is a finding worth thinking with, not a one-size-fits-all answer.
Paper: Chen, Lind, Ram & Odgers (UC Irvine + Stanford), Adolescents’ Daily Affect Predicts Their Mobile Phone Use (Not the Other Way Around), psyArXiv DOI 10.31234/osf.io/5d67p, accepted for publication in the Journal of Research on Adolescence. Code and analysis scripts are on OSF (https://osf.io/647m9/).
Conflict of interest disclosure: author MNL holds equity in Ksana Health, the commercial licensee of EARS.