
Eight years ago, one in five goods entering the United States came from China. Today it is fewer than one in twelve. Over the same stretch, the trade-weighted average U.S. tariff on Chinese goods stood at 47.5 percent in November 2025. Before I read this paper, I was carrying a very plain question:with a wall that tall, where did the goods on the shelf go?
My default answer was that eight years of trade war must have pushed global trade downhill. The data show something else: the ratio of world trade to global GDP has been essentially flat since the global financial crisis. The paper’s own phrasing is that the world is not deglobalizing; it has simply stopped globalizing further. The total is still there, and what changed is who sells what to whom. The paper names this the great reallocation, and its title is borrowed from Kazuo Ishiguro’s The Remains of the Day: the drama lies less in rupture than in reshuffling.
The conclusion up front:not a single drop of goods disappeared — the flow just went around the dam and into someone else’s market.How large is the diverted volume? The paper does the arithmetic: China exported $3.77 trillion in 2025, and the part moved out of the U.S. market equals a full year of GDP for Chile, Portugal, or Greece.
Three qualifiers to pin down before anything else, because they decide how much weight every number below can bear. First,this is a working paper, posted in September 2026 and not peer reviewed— a draft circulated inside the profession precisely so people can find fault with it, and it must not be cited as published research. Second, the three authors are affiliated with Harvard University and the International Monetary Fund, and the paper states on its title page that the views are the authors’ own and must not be attributed to the IMF, its Executive Board, or its management — so no sentence of the form “the IMF’s research concludes” is allowed anywhere. Third, every reading in this paper is a model prediction rather than a measurement; that discount gets its own section below.
1. The thing I could not explain before reading the paper
The United States began imposing tariffs on Chinese goods in 2018, and for eight years “trade war” has been the background noise of the news. The script in my head was simple: tariffs go up, trade between the two shrinks, global trade totals fall. But the trade-to-GDP ratio has been running sideways since the financial crisis. If the total is flat, the goods are still moving, and the change on the shelf can only come from another direction — the route.
The paper splits this into two sentences. The first is a judgment: the world is not deglobalizing, it has stopped globalizing further. The second is a name: what happened is a reshuffle rather than a break, so it is called a great reallocation. My own guess — the paper never says this — is that borrowing The Remains of the Day for the title is not a stylistic flourish: it warns the reader off the dramatic ending of “trade war killed globalization.” That ending is not in the data; only the rankings changed.
The judgment is there, but the ruler is not. To measure who gets hit and how hard, we first need to know how tall the wall is.
2. A paper that is asking to be picked apart
Before any numbers, the paper’s identity — because identity sets how much weight the numbers can bear.
This is an NBER working paper, released in September 2026,not peer reviewed; an earlier version was presented at a conference in February 2026. The authors, Pol Antràs, Adrian Kulesza, and Andrea F. Presbitero, are affiliated with Harvard University and the International Monetary Fund, and the paper states that its views should not be attributed to the IMF, its Executive Board, or management. A working paper is exactly that: a draft passed around the profession so that others can find fault with it, not a settled result.
The core data areproduct-level bilateral trade flows for 2023from the public CEPII-BACI database, covering 224 countries and 5,380 six-digit HS products; product-level shocks can be computed for 4,254 of them. The sample then drops economies with populations under 200,000, Hong Kong and Macao, and countries whose indices cover less than 25 percent of their trade flows, leaving110 countries. The base year is 2023, and the paper’s reason is specific: to avoid expectations building up before the 2024 U.S. presidential election.
Monthly validation uses a different source, the commercial subscription database Trade Data Monitor, with the early period running from April 2023 to March 2024 and the late period from April 2025 to March 2026. Here I have to be straight:a subscription database is not open data, so the paper cannot promise that everything is reproducible. What can be checked is the public part, plus the query platform the authors open separately.
One thing worth noticing in passing: the choice of base year shows the authors’ concern about contaminated expectations more clearly than any sentence claiming they controlled for them. With that calibration in hand, here is the first thing the paper measures.
3. How tall the wall is
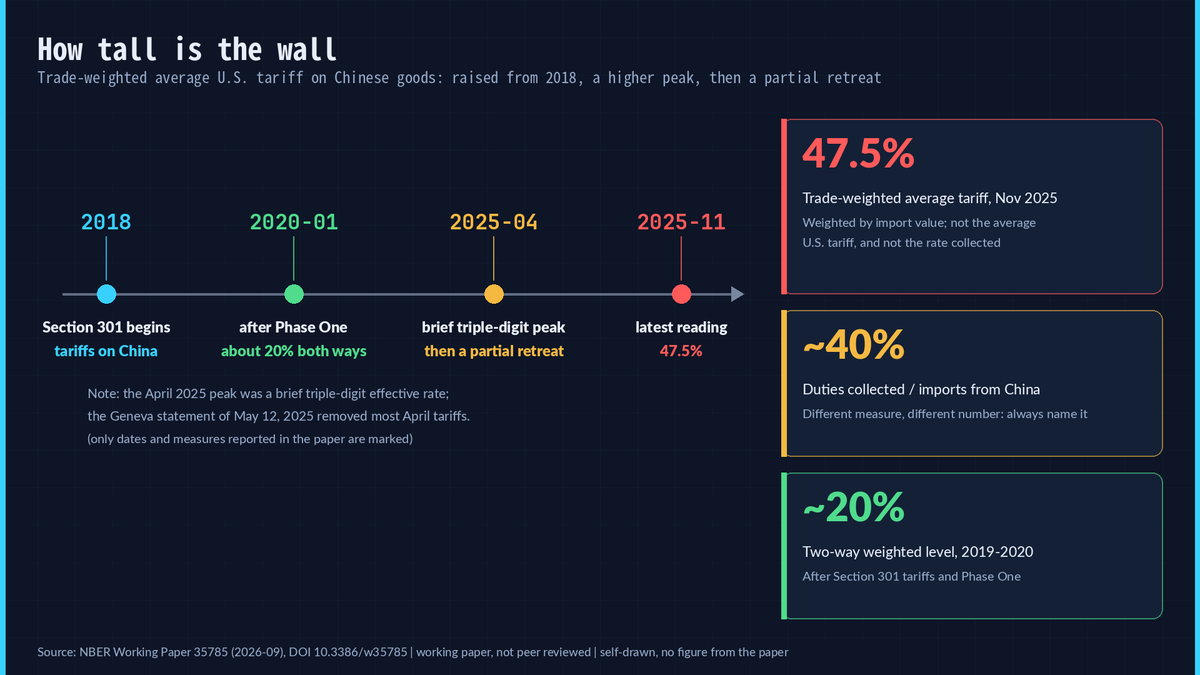
Start with one number:47.5 percent. The measure is the trade-weighted average tariff — an average weighted by import value — and the date is November 2025, citing Bown’s tariff statistics. It is not the “average U.S. tariff,” and it is not the tariff actually collected at the border; those three numbers are not interchangeable.
The timeline runs like this: tariffs began in 2018; after the Section 301 tariffs of 2018–19 and the Phase One agreement of January 2020, the trade-weighted average on both sides sat at roughly 20 percent; the executive orders of April 2025 pushed effective rates sharply higher, including brief peaks at triple-digit levels, before partially retreating — the joint statement issued after talks in Geneva on May 12, 2025 committed the United States to removing most of the April tariffs; and in the latest month the figure still stands at 47.5 percent. There is also a looser measure: duties collected relative to imports from China come out at around 40 percent, cited in a footnote from a separate tracker.
Seven percentage points separate the two figures, and the lesson I take from that gap is:whenever you see a tariff figure, ask which measure it is— statutory, weighted, or collected are three different rulers. Behind the wall, the shelf changed too, and the paper answers with two bars that are constantly misread as one.
4. Two shares, two rulers
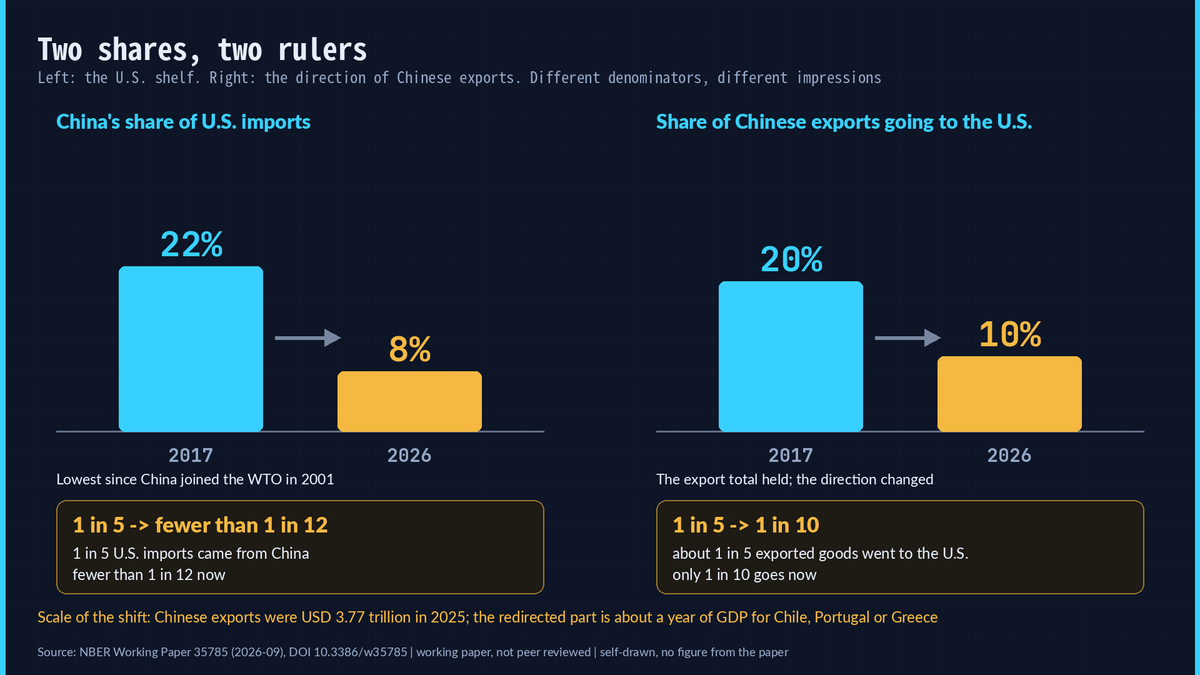
The left bar:China’s share of U.S. imports fell from 22 percent in 2017 to about 8 percent in 2026, a level not recorded since China entered the WTO in 2001. In natural frequency: eight years ago one in five goods entering the United States came from China, and today fewer than one in twelve does.
The right bar:the share of Chinese exports destined for the United States fell over the same period from around 20 percent to about 10 percent. Eight years ago roughly one in five exported goods went to the United States; now it is one in ten.
The denominators differ, so the impressions differ. The first sentence is about the American shelf; the second is about the direction of Chinese exports. Quoting only the first invites the conclusion that Chinese exports collapsed; quoting only the second invites the conclusion that American shelves emptied.Read together, they say the total held while the direction changed— and the scale of that change is the arithmetic from the opening: the redirected volume equals a year of GDP for Chile, Portugal, or Greece.
Total unchanged, direction changed — that is still just description. The paper’s real work comes next: what ruler can measure who gets hit, and by how much.
5. The old ruler cannot measure an asymmetric hit
The traditional measure is export and import basket similarity: lay what two countries sell side by side, see how alike they are, and the more alike, the more they count as competitors. The ruler has a built-in flaw — it is symmetric. The paper reaches for an extreme illustration: by its arithmetic, China is impacted by competition from Honduras exactly as much as Honduras is impacted by competition from China. One side is an elephant, the other an ant, and the ruler reports equal weight.
Once the authors swapped rulers, the rankings turned over, and the correlations are low enough to be striking:
- similarity in exports and the export competition index correlate at only0.493across countries;
- similarity in imports and the import competition index correlate at**−0.039**, essentially zero;
- only Czechia, Japan, and Poland appear in the top twenty of both import lists.
The list built on “how alike” starts with Canada, the United Kingdom, France, Germany, and Japan. The list built on “how much it hurts” starts with Vietnam, Cambodia, Pakistan, Madagascar, and Japan.
My reading: this is the methodological takeaway worth carrying out of the episode —same data, different ruler, different conclusion. Before accepting any international ranking, ask whether it measures similarity or incidence. What the new ruler actually measures deserves a gauge-by-gauge look.
6. Four gauges on the same flow of water
The paper’s approach is to fit four gauges to the redirected flow. It calls the four angles the four margins and calls the readings exposure indices. Each index measures one thing:
- export competition: how much the redirected Chinese goods squeezeyour exportsin third markets, read as a predicted export decline — higher is worse;
- import competition: how much redirected Chinese goods squeeze domestic producers’ sales inyour own market, read as a predicted decline in domestic sales;
- consumer gains: how much cheaper Chinese goods cutyour import prices, read as a predicted decline in import prices —this is not a consumer price index and not the overall cost of living;
- sourcing gains: how much cheaper Chineseintermediate inputscut costs for your downstream industries, read as a predicted export gain.
Three qualifiers travel with the four gauges. First, these readings aremodel predictions, not measurements, covering 110 countries on a 2023 base year. Second, they do not conflict with each other: the same country can hold four different ranks across four lists. Third, the first two gauges measure being squeezed, and the last two measure the cheapening picked up along the way — one gauge, one angle.
One detail deserves a pause: sourcing gains correlate with upstream import competition at only 0.233, but with upstream consumer gains at 0.586. That pattern saysthe gauge tracks cheaper inputs rather than eased competition— it measures a cost chain rather than a competitive position.
Four gauges in place. Does any country actually get flooded and irrigated by the same flow at once? Yes — and it happens to be the one everyone cites.
7. Vietnam: flooded and irrigated by the same flow
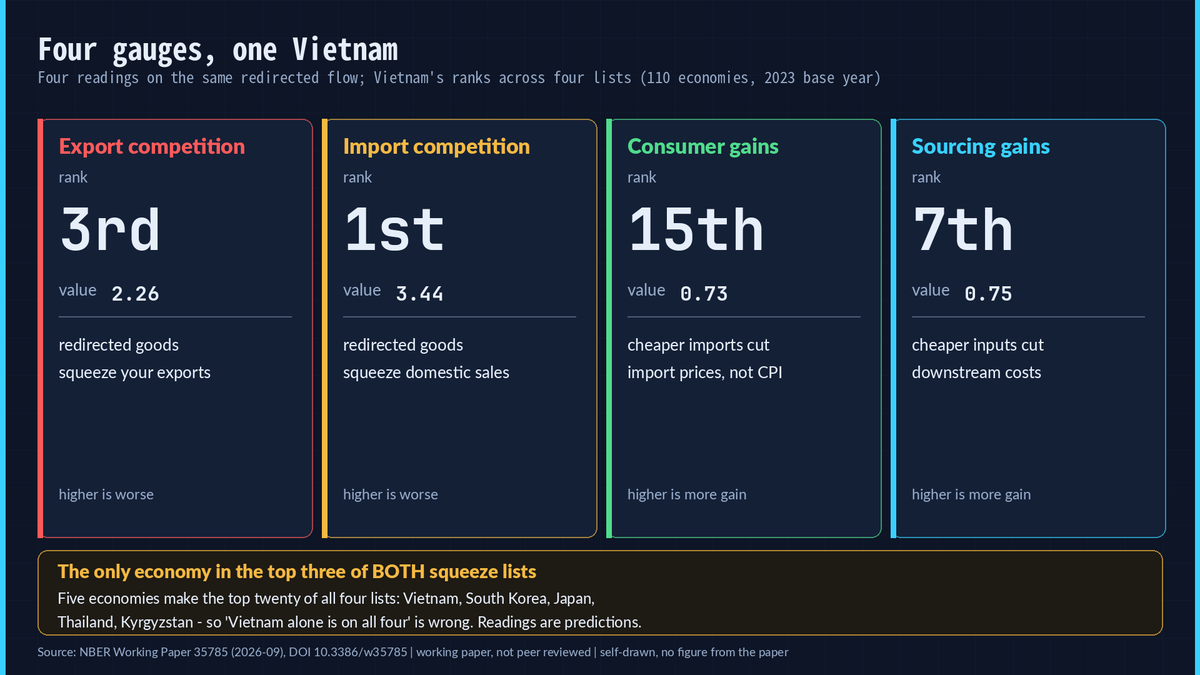
Vietnam appears in thetop twenty of all four lists— but the wording matters: five economies make the top twenty of all four, namely Vietnam, South Korea, Japan, Thailand, and Kyrgyzstan, so “Vietnam is the only one on all four” would be wrong. What is unique here is the two squeeze lists:3rd in export competition (2.26) and 1st in import competition (3.44), the only economy in the top three of both.
It also shows up on the two upside lists:15th in consumer gains (0.73) and 7th in sourcing gains (0.75).
The paper has a line for exactly this situation: when two giants fight, smaller economies are not simply flies on the wall, unaffected by the fight. The water hits it from outside and keeps hitting once it comes through the door. The same flow can be both pressure and a dividend for the same country.
Soexposure is never singular. Reducing a country to “winner” or “loser” fails in front of four gauges, and Vietnam adds one more warning — its readings come from the export market and the domestic market at the same time, so any account built on a single trade flow misses half the picture. Inside one country, the readings are not evenly spread either; once the indices are decomposed to the product level, the picture turns surprisingly concentrated.
8. One country’s reading usually rests on a few products
- 48.07 percentof Hungary’s export competition reading comes from lithium-ion batteries;
- 32.19 percentof Vietnam’s comes from cell phones;
- Armenia’s comes 25.87 percent from color televisions and Kyrgyzstan’s 26.64 percent from radiators and parts;
- among the most U.S.-dependent products, frozen cobia had a U.S. exposure of1.000in 2023 — the entire crop went to the United States — with fresh and frozen anchovies at 0.974.
The sourcing side is more extreme:92.57 percentof Kazakhstan’s reading and96.48 percentof Azerbaijan’s come from crude petroleum; 73.99 percent of Uganda’s comes from semi-manufactured gold and 59.59 percent of Ethiopia’s from coffee. Consumer gains are far more dispersed — the top five products average only 26.1 percent of that index, against 37.6 percent for import competition.
A single fish explains the point better than a country.A product with U.S. exposure of 1.000 has no buffer market once the wall goes up— it cuts prices to find new buyers, or it disappears from the shelf. As for the crude petroleum behind Kazakhstan’s and Azerbaijan’s ninety-plus percent, I lean toward this reading: cheap Chinese inputs travel down the input-output chain and end up as a cost advantage in their oil exports — a causal chain much longer than the four words “a country benefits,” and one the paper does not derive in full, so the interpretation is mine.
That is the structure of the indices. What remains — and matters most — is whether the readings match what actually happened.
9. Checks: the half that matched and the half that did not
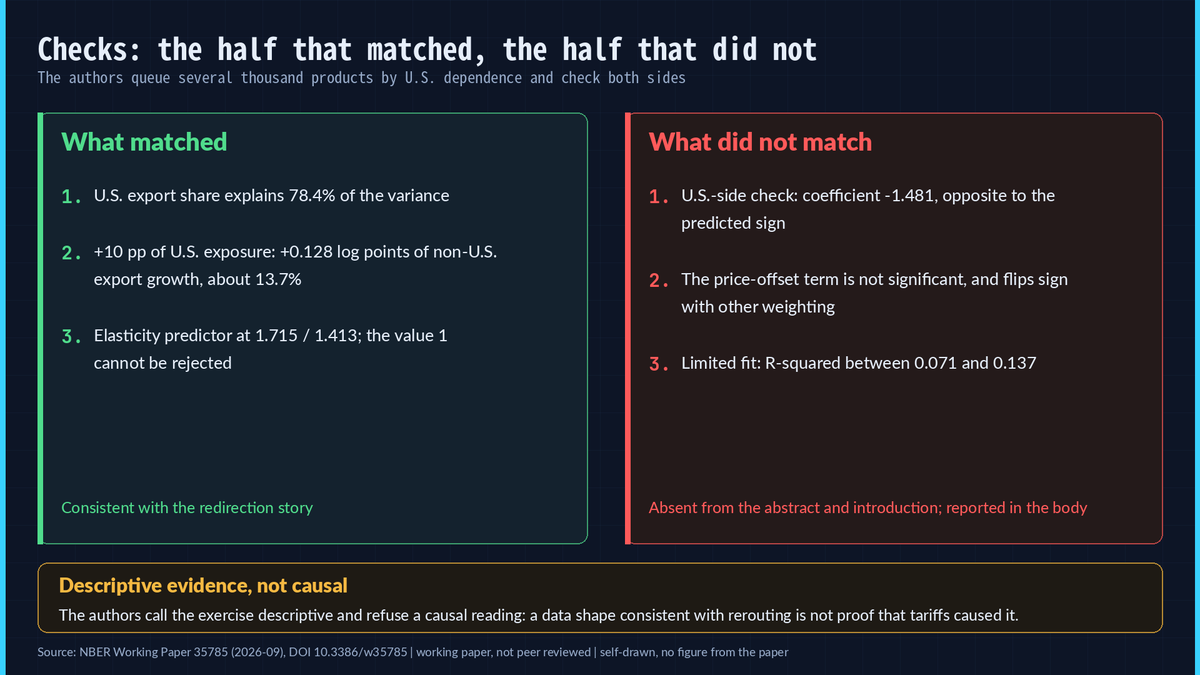
The authors queue several thousand products by their dependence on the U.S. market and then look at where those products went.Three things matched:
- in the variance decomposition of product-level price shocks,U.S. export share alone explains 78.4 percentof the variation, the elasticity term 18.9 percent, and tariff changes the remaining 2.6 percent;
- in regressions of export growth to non-U.S. destinations, the coefficient on U.S. exposure is significantly positive:a 10-percentage-point higher exposure to the U.S. market is associated with 0.128 log points, about 13.7 percent, higher growth to a non-U.S. destination;
- the elasticity-based predictor the model calls for comes back at 1.715 and 1.413, andthe hypothesis that the coefficient equals the model’s predicted value of 1 cannot be rejected.
The failures were reported too:
- run the same direct check on the U.S. side and the coefficient on U.S. exposure is negative, around −1.481, the opposite of the positive sign the model predicts; the paper writes that the direct log-change test fails to recover the signs predicted by the model;
- in the structural decomposition of the levels specification, the price-offset channel — Chinese exporters cutting prices to absorb part of the tariff —is not statistically significant, and with a different weighting its sign flips;
- both failures are absent from the abstract and the introduction, and appear only in the body.
There is a third limit: fit. Those non-U.S. export regressions carry R-squared values between 0.071 and 0.137.The mechanism points in the right direction while explaining a limited share, and those two facts have to be stated together— reporting only the first half is cheerleading, reporting only the second is a hatchet job, and neither is honest. On causality the authors draw the line themselves: the exercise is descriptive and they refrain from interpreting it as a causal estimate of tariffs. The accurate sentence is that the data shape is consistent with the redirection story; the paper does not prove tariffs caused the rerouting.
Right direction, limited fit, and two failed checks that never made the abstract — stack those together and the list of discounts to apply before quoting these readings writes itself.
10. Five discounts on the readings
First discount:the readings are model predictions. The paper states in a footnote that the indices should be interpreted as predicted changes for the subset of goods and countries where data is available rather than as observed changes.
Second discount:the magnitudes in the introduction are the extremes. Export declines of 0.4 to 0.9 percent, domestic sales falling by more than 3 percent among the most exposed economies, and consumer and sourcing gains above 1 percent for some countries refer to a handful of the world’s largest economies and the most exposed cases rather than to a typical outcome across all 110 countries.
Third discount:descriptive, not causal. Tariff policy is itself endogenous, and the authors explicitly refuse to read the regressions as causal.
Fourth discount:redirection is neither a welfare gain nor a welfare loss. All four gauges report gross numbers — exports squeezed, sales squeezed, import prices falling. Employment effects and distributional winners and losers are not computed; the net account is left blank. Consumer gains are measured at import prices, and import prices pass through importers, wholesalers, and retailers before they reach anyone’s wallet.
Fifth discount comes from the knowledge limits the paper states itself, three of them together: there is no product-level data on domestic sales, so the import competition weights proxy export structure for sales structure, and the authors write that those results should be taken with a grain of salt; the input-output links behind sourcing gains are machine-generated binary connections, each input weighted uniformly, and only one round of direct cost effects is counted rather than a chain reaction through the whole network; the elasticity estimates come from 1993–2007 data applied to a 2023 base year, and the paper concedes that preferences and technology have certainly had scope to change.
These five discounts are not attacks on the paper; they are a threshold forwhoever quotes it. When a headline says a country cashed in or got crushed, ask which discounts were applied — and at that point the apparatus immediately becomes useful.
11. Reading the news with the four gauges
One directly usable scenario: in 2025 the European Commission created a dedicated import-surveillance tool to watch for goods shut out by tariffs elsewhere and redirected into the EU. Redirection is not a metaphor here; it is something customs agencies are handling.
Another reminder is more practical:do not use a country’s tariff rate to guess whether its exports to the United States rise or fall. The paper tried that relationship and found it unstable — the t-statistic falls from −3.91 to −0.87 under robust standard errors, and once China is dropped the pattern largely disappears. Counterexamples sit alongside it: Taiwan and Vietnam kept exporting strongly to the United States under announced Liberation Day rates of 32 and 46 percent.
So the next time a headline says exports to the United States surged while imports from China also surged, pull out the four gauges and ask four questions: how much were its exports squeezed? How much of its home market was squeezed? How much cheaper did its imports get? How much cheaper did its downstream inputs get? After four questions, a single word like “surge” loses its bite.
12. Next time a headline says a country cashed in, pull out the four gauges
This paper does not hand you a prediction; it hands you a pair of glasses. It cannot tell you what tariffs will do tomorrow, and it keeps no ledger for either side — it even tells you plainly that its checks matched in half and failed in half, that its explanatory power is limited, and that its readings are predictions.Its value sits precisely in that candor: the next time someone hands you a single word — “surge” or “collapse” — and asks you to pick a side, you have four questions to hand back.
To look up your own country, the authors open the country values, rankings, and product-level decompositions of all four indices on a query page at pantras-hash.github.io/remains_of_the_trade. To check the original, the DOI is 10.3386/w35785. And when you repeat any of it, carry its qualifiers with you — a working paper, not peer reviewed, model predictions, and views that the paper itself says are not the IMF’s.
Source: NBER Working Paper 35785 (2026-09), DOI 10.3386/w35785 | Working paper — not peer reviewed | fig01–fig04 are all self-drawn; no figure from the paper is used | The paper states that its views are those of the authors and should not be attributed to the IMF.